
Moving Averages in Trading — What They Actually Show
A moving average smooths price into a single line that shows trend direction. Learn what it actually shows, how to read it, and where it fails.
A moving average is the average price of an instrument over a set number of bars, redrawn on every new bar so the line slides forward with price. That is the whole mechanic. It smooths noisy price data into a single line so you can read the direction underneath the noise. What it does not do is predict the next move. A moving average is a lagging measure of what already happened, and treating it as a forecast is where most beginners lose money with it.
The value of a moving average is context, not signals. It tells you which side of the recent average price is in control and how stretched price has become from that average. Used that way, it sharpens decision-making. Used as a buy-and-sell trigger on its own, it produces a steady stream of low-quality trades. The line is the same in both cases. The difference is the trader reading it.
What a moving average means on a chart
The moving average meaning is straightforward once you separate the calculation from the interpretation. Take the closing prices of the last 20 bars, add them, divide by 20. That is a 20-period simple moving average for the current bar. On the next bar, the oldest close drops off and the newest close enters, so the value updates and the plotted line advances. Connect those values and you get the smooth line traders watch.
The period you choose decides what the line describes. A short period hugs price and reacts fast. A long period sits further away and moves slowly. Neither is more correct. They answer different questions: a 20-period average describes the near-term drift, a 200-period average describes the larger trend most participants are positioned around.
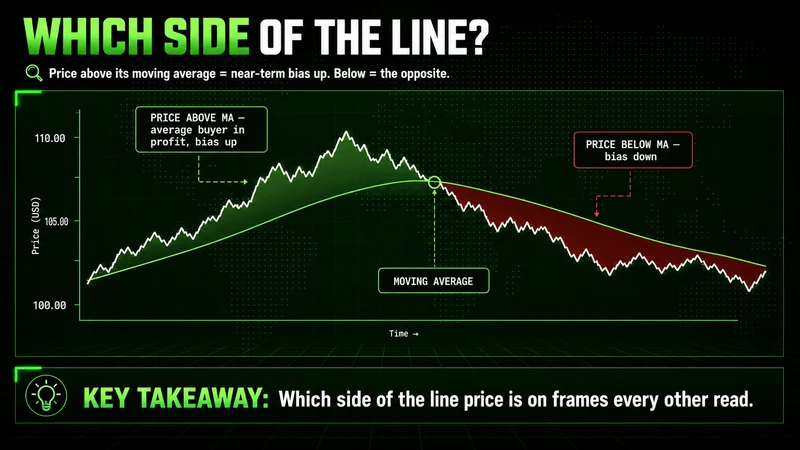
Price trading above its moving average means the recent average buyer is in profit and the near-term bias is up. Price below it means the opposite. That single read — which side of the line price is on — is more useful than any crossover alert, because it frames every other decision you make on that chart.
Simple vs exponential moving average — which to use
The simple vs exponential moving average question comes up early, and the honest answer is that the difference matters less than beginners assume. Both smooth price. They weight it differently.
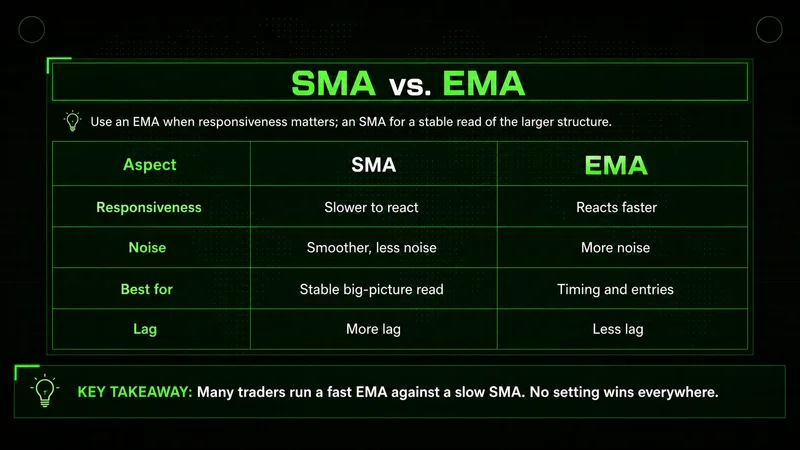
- Simple moving average (SMA) — every bar in the window counts equally. The 50 closes in a 50-period SMA each carry the same weight. It is smoother and slower, which is what you want for reading a larger trend.
- Exponential moving average (EMA) — recent closes carry more weight than older ones. It reacts faster to a change in price, which helps on lower timeframes and in fast conditions, but it also produces more false turns in choppy markets.
The practical takeaway: use an EMA when responsiveness matters and you accept more noise, use an SMA when you want a stable read of the larger structure. Many traders run both — a fast EMA for timing against a slow SMA for context. There is no setting that wins in every condition, and chasing the perfect one is wasted effort.
How to read moving averages on a chart
Reading a moving average well is mostly about reading the relationship between price and the line, not the line alone. Three relationships carry most of the information.
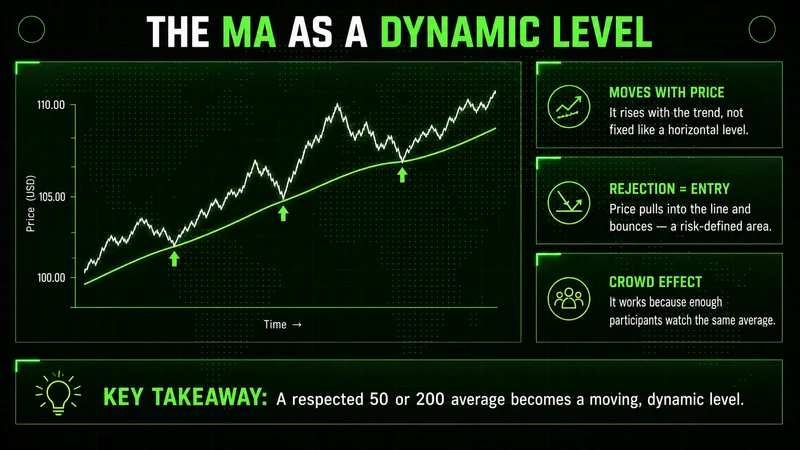
First, slope. A rising line means the average price is climbing; a flat line means there is no trend to ride and the average is just tracking a range. Second, distance. When price runs far above the line, it is over-extended and prone to snapping back toward it — not a reversal signal, a stretch warning. Third, reaction at the line. In a healthy trend, price pulls back to the moving average and resumes. That repeated behavior is what makes the line act as moving average support and resistance.
That support-and-resistance read is the part worth slowing down on. A 50-period or 200-period average that price keeps respecting becomes a dynamic level — it moves with price instead of sitting at a fixed price like a horizontal level. When price pulls into that line and shows rejection, you have a risk-defined area to work with: a reaction confirms the trend is intact, and a clean break through it with acceptance tells you the character has changed. The line is not magic. It works because enough participants watch the same averages and act around them.
Choosing your moving average periods
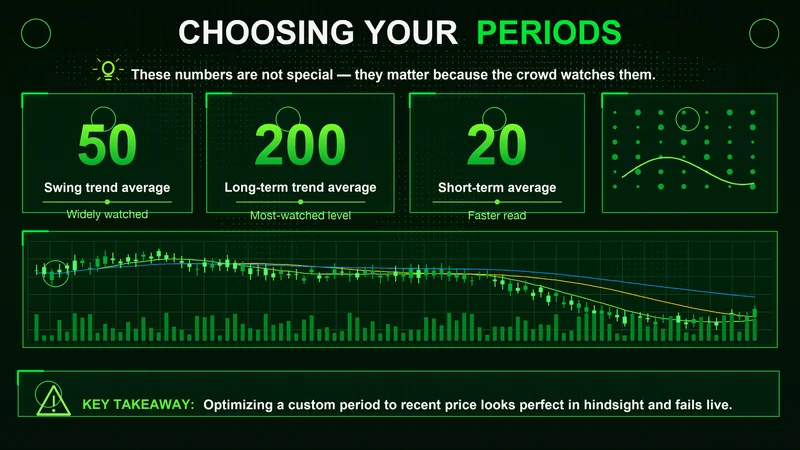
Moving average periods explained simply: the number is the count of bars the average covers, and a handful of conventional settings dominate because so many traders use them.
- 20-period — near-term trend and momentum on the active timeframe.
- 50-period — the intermediate trend; widely watched on daily charts.
- 200-period — the long-term trend and the line institutions and algorithms reference most.
Those numbers are not special in themselves. They matter because they are crowded — price reacts at the 200-day average partly because a large share of the market is watching the 200-day average. Start with these conventional settings before you experiment. Optimizing a custom period to fit recent price almost always produces a number that looked perfect in hindsight and falls apart live.
Trading the moving average crossover
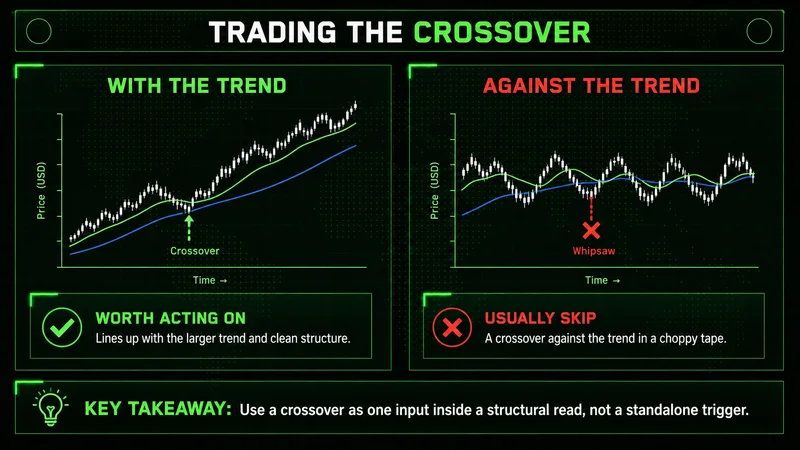
The moving average crossover is the best-known moving average trading strategy, and also the most overtraded. The mechanic: a faster average crossing above a slower one signals momentum turning up, and crossing below signals it turning down. A common pairing is a fast EMA against a slower SMA, or the 50 crossing the 200.
The logic is sound — a crossover confirms that the near-term average has shifted relative to the longer one. The problem is that a crossover is a lagging confirmation of a move that already started. In a strong trend it keeps you on the right side. In a range it whipsaws you, firing a long signal at the top of the range and a short signal at the bottom, repeatedly.
A crossover tells you the trend already turned. It is confirmation, not a crystal ball, and trading it without context is how a clean-looking system bleeds an account in a sideways market.
Use crossovers as one input inside a structural read, not as a standalone trigger. A crossover that lines up with the larger trend and a clean structure is worth acting on. A crossover against the larger trend, in a choppy tape, usually is not.
Where moving averages stop working
Every moving average shares one weakness: it lags, and it assumes a trend exists. In a ranging market that assumption breaks, and the indicator turns from a help into a trap. Price oscillates back and forth across a flat line, every crossover fails, and the average gives you the worst entries available — buying near the top of the range and selling near the bottom. The line is doing exactly what it is built to do. The conditions just make it useless.
The second failure is speed. At a sharp reversal — a gap, a news-driven flush, a fast momentum shift — the moving average is still pointing the old direction while price has already moved. By the time the line catches up, the easy part of the move is gone and you are entering late. On NQ in particular, that lag is brutal: Nasdaq volatility can invalidate a clean-looking moving average setup within minutes, and a trader leaning on the line alone reacts a beat too slow.
This is why the line is a tool and not a decision-maker. It earns its place when you already know whether you are in a trend or a range, and it misleads you when you ask it to make that call for you. Indicators do not remove the work of reading context. They organize it.
Common moving average mistakes beginners make
Most of the damage comes from a short list of repeated errors. A quick checklist of what to avoid:
- Treating crossovers as automatic entries. A signal without structural context is a coin flip with extra steps.
- Stacking too many averages. Five lines on one chart is not more information, it is noise dressed as confirmation.
- Optimizing the period to fit the past. A setting tuned to recent bars is fit to history, not to the market.
- Trading the line in a range. If the average is flat, it has nothing to tell you about direction.
- Ignoring distance. Entering after price has stretched far from the average means buying the part of the move with the worst risk.
- Forgetting it lags. The line confirms; it does not predict. Position size and invalidation still come first.
None of these are exotic. They are the predictable result of asking a smoothing line to do a job it was never built for.
FAQs
What is a moving average in trading? It is the average price of an instrument over a set number of bars, recalculated on each new bar so the plotted line moves forward with price. It smooths out short-term noise to show the underlying direction, and it is a lagging measure of past price rather than a forecast.
What is the difference between an SMA and an EMA? A simple moving average weights every bar in its window equally, which makes it smoother and slower. An exponential moving average weights recent bars more heavily, which makes it react faster but also produces more false turns in choppy conditions.
What are the best moving average periods for beginners? The 20, 50, and 200 are the conventional starting points. They matter mostly because they are crowded — a large share of the market watches them — so price tends to react around those levels. Begin there before experimenting with custom settings.
Do moving averages work in all market conditions? No. They assume a trend exists, so they perform well in trending markets and poorly in ranging ones, where they whipsaw. They also lag at sharp reversals, confirming a turn only after the fastest part of the move has passed.
Worth the read?


