Multi Timeframe Trading Strategy — When Alignment Lies
A multi timeframe trading strategy works by reading context before the entry, not by stacking charts. Where alignment helps, and where it quietly lies.
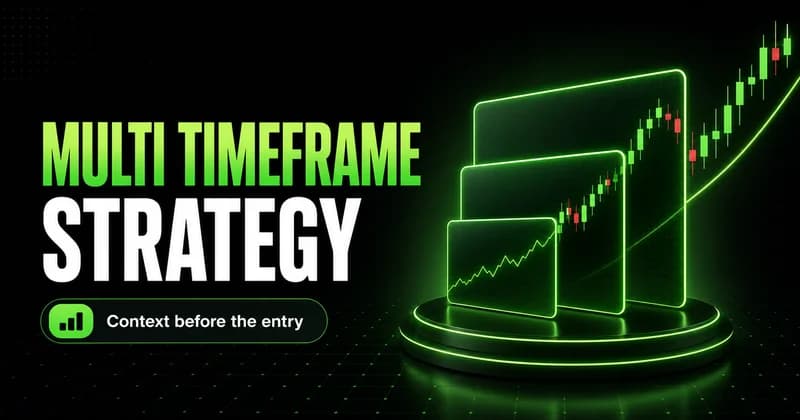
A multi timeframe trading strategy reads the same market at more than one zoom level so the entry sits inside real context instead of next to it. You define the trend and the levels on a higher timeframe, then drop down to time the entry on a lower one. That part is uncontroversial. The part most guides skip is the failure mode: alignment across timeframes feels like confirmation, but a lot of the time it is just coincidence dressed up as a signal.
That distinction matters because traders treat agreement between charts as permission. Three timeframes pointing the same way looks like an edge. Often it is the same noise repeated at three scales. The technique is useful, but it is reactive structure-reading, not a prediction engine, and it stops adding value the moment you start stacking charts to manufacture a yes.
What a multi timeframe trading strategy actually does
Multi timeframe analysis means looking at one instrument through several time windows at once. Each window has a specific job, and the jobs do not overlap:
- The higher timeframe carries the trend and the broader context.
- The middle timeframe shows the setup forming inside that context.
- The lower timeframe gives the precise entry and the place to define risk.
The point is not more charts. The point is sequence: read context first, then look for the trigger. When traders skip the sequence, they find a clean pattern on a fast chart and act on it without checking whether the slower chart even supports the direction. The fast chart is where most false signals live, because short windows are dominated by noise. The slower chart is where the structure that actually moves price tends to sit.
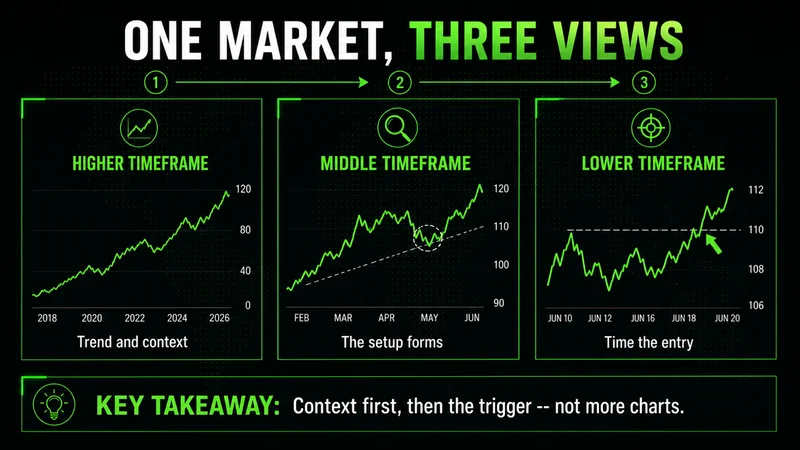
Think of it as one decision split across three questions. The higher timeframe answers which way. The middle timeframe answers where. The lower timeframe answers when. Each question is narrow, and that is what keeps the read honest. Asking a single chart to answer all three at once is how traders end up reading a routine pullback as a reversal, or a deep retracement as a trend that is still intact.
The approach is not married to any one method. It works the same whether you read raw price structure, support and resistance, moving averages, or a momentum tool, because it is a framework for ordering decisions rather than a signal generator. Whatever you use to read a single chart, you apply it top down across the set.
Top-down analysis: read the higher timeframe first
Top down analysis starts at the top and works down. You open the higher timeframe before anything else, and you are not hunting for an entry there. You are defining three things:
- The trend direction, from the sequence of swing highs and swing lows.
- The last clear swing high and swing low that frame the current move.
- The key levels price is reacting to, where buyers or sellers have shown up before.
That read gives you a bias and, just as important, the level that makes the bias wrong. A higher timeframe trend is not a guarantee of continuation. It is the direction that currently has the weight of structure behind it, which is a different and more useful claim.
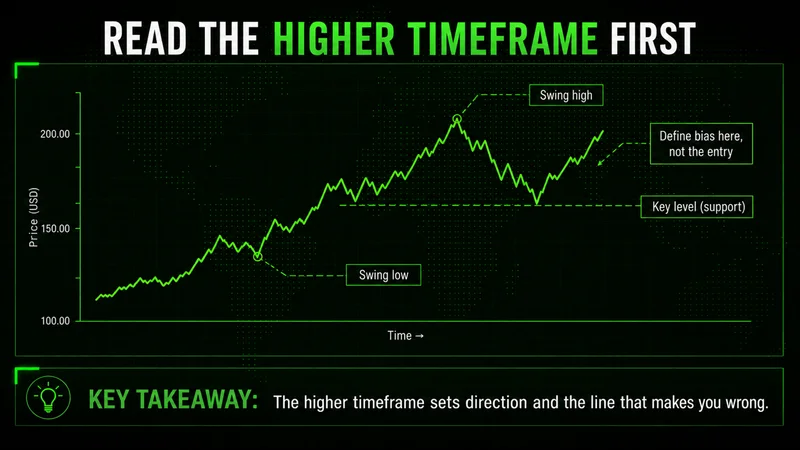
What counts as a higher timeframe is relative to how you trade. For a swing trader the daily is the context chart; for a scalper the 15-minute plays that role. The label does not matter. What matters is that one chart in your set is clearly the slowest and you treat it as the authority on direction.
Define invalidation here, on the slow chart, not later in the heat of the entry. If price reclaims and accepts back through the level that anchored your bias, the read is done and you stand down. Writing that line down before you drop to the entry chart is what stops a losing idea from quietly turning into a held position you keep defending.
Which trading timeframes to combine
The trading timeframes you pick should be spaced far enough apart to show genuinely different information. A common rule is a factor of roughly four to six between each step. A 1-hour and a 2-hour chart tell you almost the same story; a 1-hour and a daily do not. Too close together and you are looking at one timeframe twice.
The right set depends on how long you hold. The combinations below are a starting point, not a law:
| Style | Context (higher) | Entry (lower) |
|---|---|---|
| Scalping | 15-minute | 1-minute / 5-minute |
| Day trading | 4-hour | 15-minute / 1-hour |
| Swing trading | Daily | 1-hour / 4-hour |
| Position trading | Weekly | 4-hour / Daily |
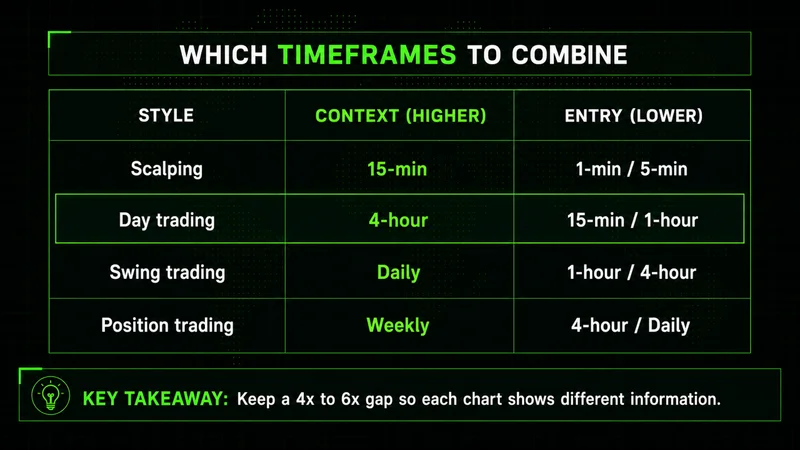
Three timeframes is usually enough. One for context, one for the setup, one for the entry. The middle chart is optional for shorter-term traders who can read the setup directly off the entry chart, but the context chart is not. Skipping the slow chart to act faster is the most expensive shortcut in this whole approach.
For day trading specifically, the 4-hour and 1-hour pairing for context with a 15-minute entry tends to be a workable default, because it spans a full session without forcing you to track five charts at once. Start there and adjust only if the spacing stops showing you different information.
Using the lower timeframe for entries
Once the higher timeframe sets the bias, the lower timeframe entry has exactly one job: time the entry in the direction the slow chart already approved. The lower timeframe does not get a vote on direction. It refines location and risk inside a decision that is already made.
The sequence looks like this:
- Confirm the higher timeframe bias and mark the level you expect price to react at.
- Wait for price to reach that level. Do nothing until it does.
- Drop to the lower timeframe and wait for a confirmation trigger in the bias direction.
- Enter with a defined stop just beyond the level, sized so the loss is an operational cost, not an event.
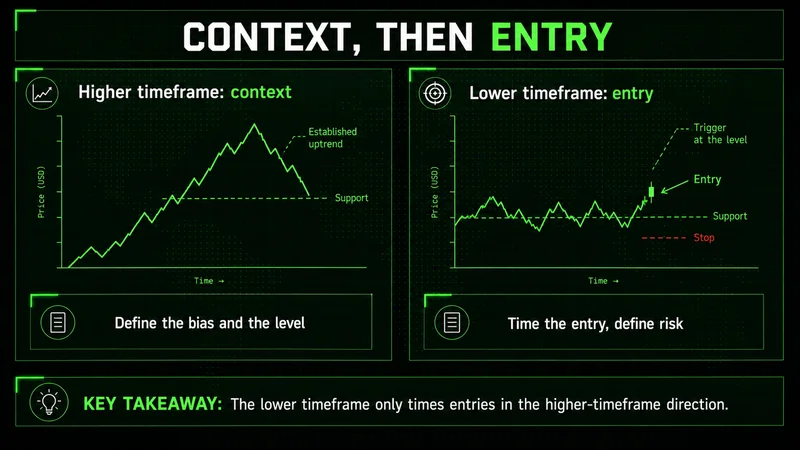
This is where multi timeframe confirmation earns its name. The confirmation is not three charts agreeing in the abstract. It is the lower timeframe showing a real reaction at the specific level the higher timeframe flagged. A trigger that appears anywhere else is just a fast-chart pattern, and fast-chart patterns are cheap.
Support and resistance make this concrete. A level drawn on the higher timeframe is the one worth trading; the same level marked only on a fast chart carries far less weight. When a higher timeframe support lines up with a lower timeframe reversal trigger, you have a risk-defined entry with a clear invalidation a few ticks away. That overlap, not the number of indicators on the screen, is the actual edge.
When the timeframes disagree
Most guides assume the charts line up. They often do not. The higher timeframe says up and the lower timeframe is selling off, or the slow chart is ranging while the fast chart trends. This is the case that decides whether a multiple timeframe strategy actually protects you or just slows you down.
The rule is simple, and it is a rule, not a judgment call you make trade by trade. Ask one question: does the lower timeframe agree with the higher timeframe trend?
- If yes, take the entry with risk defined at the level.
- If no, stand aside and wait for alignment.
- Never trade the lower timeframe against the higher timeframe bias because the fast chart looks exciting.
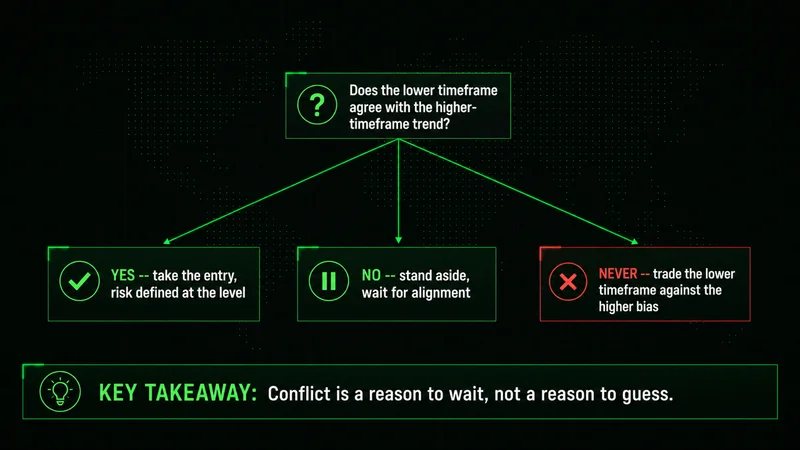
This is also where the technique itself breaks down, and it is worth naming plainly. Timeframe alignment reads cleanly in normal conditions; during a macro-driven session or a news-driven expansion, the higher timeframe structure you anchored to can invalidate within minutes, and the lower timeframe leads the slow chart instead of confirming it. In those windows the whole top-down logic inverts, and the disciplined move is to size down or stand aside, not to trust a framework that was built for calmer tape.
There is a subtler version of disagreement worth watching for. Sometimes the charts agree on direction but not on timing: the higher timeframe is mid-trend while the lower timeframe is stretched and due a pullback. Entering on that is technically with the trend, but you are buying right before the fast chart pulls back into your stop. Alignment of direction is not the same as alignment of timing, and the entry needs both.
The trap of stacking too many timeframes
There is a quiet belief that if three timeframes are good, five are better. They are not. Past a point, adding charts does not add edge. It adds reasons to hesitate and reasons to override your own rules. Most traders do not have a confirmation problem. They have a discipline problem, and more screens make it worse.
Stacking timeframes also lets you manufacture the answer you want. With enough charts open, you can always find one that agrees with the trade you already decided to take. That is not confirmation. That is curve-fitting your own bias in real time, and it feels productive while it quietly erodes the read.
The fix is a fixed set, chosen in advance:
- Commit to three timeframes for context, setup, and entry before the session starts.
- Do not add a fourth chart mid-trade to break a tie between the other three.
- If the committed set does not agree, treat the tie as already broken, and the answer as no.
That last point is the one traders fight. A tie is not an invitation to keep searching for a tiebreaker. It is the signal itself, and the signal is to wait.
Common multi timeframe trading mistakes
The same handful of errors show up again and again, and none of them are about chart-reading skill. They are about process:
- Starting on the entry chart and only checking the higher timeframe after the fact, to justify a trade already taken.
- Choosing timeframes too close together, so the analysis is one chart wearing three labels.
- Treating any lower timeframe pattern as a signal, regardless of whether it sits at a higher timeframe level.
- Forcing a trade when the timeframes conflict instead of standing aside.
- Adding more timeframes during a drawdown, looking for a chart that finally says yes.
Notice the through-line. Every one of these is a sequence error or an impatience error, not an analysis error. The market rewards waiting for alignment far more than it rewards finding another setup, and most of these mistakes are just versions of refusing to wait.
How to build the habit
A multi timeframe trading strategy works when it stays a process and fails when it becomes a search for permission. The routine is short enough to run before every trade:
- Read the higher timeframe first and define the bias and the level that makes you wrong.
- Use the lower timeframe only to time the entry in that direction.
- When the charts disagree, stand aside instead of guessing.
- Keep the set to three timeframes, spaced four to six apart, decided before the session.
The edge here is not in the number of charts. It is in the order you read them and the discipline to do nothing when they do not line up. Conflict is information, not an obstacle, and standing aside on a bad read protects far more capital than any single entry adds. Context first, then the trigger, and patience in between.
Worth the read?