
RSI Trading Strategy for Beginners — A Confirmation Tool
An RSI trading strategy for beginners is a confirmation tool, not a buy-sell trigger. Overbought above 70 can stay overbought through a strong trend.
An RSI trading strategy for beginners works best when you treat the RSI as a confirmation tool, not a buy or sell button. The relative strength index measures how stretched momentum is on a scale of 0 to 100. A reading above 70 is called overbought and a reading below 30 oversold, but those numbers describe a condition, not an order to act. The most expensive beginner mistake is selling the moment RSI prints 70, because in a strong trend it can stay there for a long time while price keeps moving against the short.
Most guides teach the RSI backward. They lead with the 70-equals-sell, 30-equals-buy rule and present it as a mechanical system. In live conditions that rule fails often enough to drain a small account quietly. A better starting point is simple: the RSI improves the quality of entries you already have a reason to take. It does not generate those reasons by itself.
What an RSI trading strategy actually does
The RSI is a momentum oscillator built by J. Welles Wilder. It compares the size of recent gains to the size of recent losses over a set number of bars and turns that ratio into a single line that moves between 0 and 100. When recent candles are dominated by strong up closes, the line rises. When down closes take over, it falls.
That single line tells you one thing well: whether momentum is extended or balanced. It does not tell you where price is going next. This distinction matters because beginners often expect an indicator to predict. The RSI is reactive, not predictive. It reflects what price has already done and gives you context for what you are looking at.
Used this way, an RSI trading strategy is a filter layered on top of a plan. You decide where you would trade based on structure, then ask the RSI whether momentum agrees. When the answer lines up with your read, the setup is higher quality. When it disagrees, you have a reason to wait. The indicator earns its place by removing low-quality trades, not by finding magic entries.
The line answers three practical questions at a glance, and those three answers are most of what a beginner needs from it:
- Is momentum stretched or balanced right now? The distance from the midline tells you.
- Which side has been in control recently? Above 50 favors buyers; below 50 favors sellers.
- Is momentum starting to disagree with price? That gap is the divergence signal covered below.
None of these answers is an order to trade. Each is a piece of context that makes a decision you have already framed a little sharper.
What the RSI scale is actually telling you
The 0-to-100 range breaks into three useful zones, and reading them correctly is the foundation of everything else.
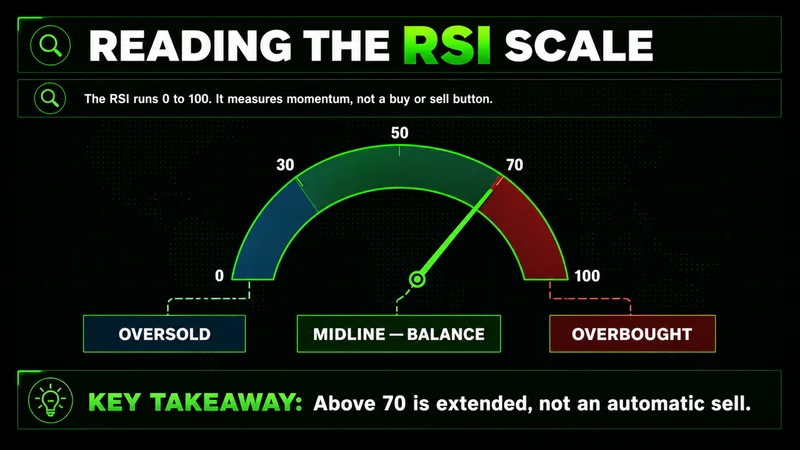
- Below 30 is oversold. Selling pressure has been heavy and recent losses dominate the calculation. This is where a bounce becomes more likely, not certain.
- Above 70 is overbought. Buying pressure has been heavy and recent gains dominate. A pullback becomes more likely, not a sure thing.
- The 50 midline is the balance point. When the RSI holds above 50, buyers are generally in control. When it sits below 50, sellers are. Many experienced traders watch the 50 cross more closely than the 70 and 30 extremes.
The key word in all three is "more likely." The RSI shifts probability; it does not flip a switch. Overbought is a measure of how far momentum has stretched, and stretched conditions can persist. Treat the zones as information about the current environment, not as automatic triggers.
Best RSI settings for beginner traders
The default RSI setting is 14 periods, and for a beginner that is the right place to stay. The RSI 14 strategy that most platforms ship with has been tested by millions of traders across decades, and changing it before you understand the default usually adds noise rather than edge.
Shorter and longer periods exist for a reason, but they are a later decision:
- A 14-period RSI suits swing trading and most beginner timeframes. It reacts at a reasonable speed without firing on every small wobble.
- Shorter settings such as 5 to 9 periods make the line more sensitive. They generate more signals and more false ones, which is the opposite of what a beginner needs.
- Longer settings such as 21 to 30 periods smooth the line for slower, position-style holding.
The level lines matter as much as the period. The standard 30 and 70 thresholds work well in balanced, ranging conditions. In a strong trend, many traders widen them to 20 and 80 so the indicator stops screaming overbought every time a healthy uptrend pauses. Start with 14 and the 30/70 levels. Change one variable at a time, and only after you have watched how the default behaves on the market you actually trade.
A simple RSI strategy you can actually follow
Here is a simple RSI strategy with examples of the logic, built for a ranging market where the RSI is at its most reliable. The goal is not to trade every signal. It is to take a small number of higher-quality ones.
- Identify the condition. Wait for the RSI to drop below 30 into oversold during a market that has been ranging, not trending hard in one direction.
- Wait for the turn. Do not buy while the line is still falling. Let the RSI cross back above 30, which shows selling pressure is easing.
- Confirm with price. Look for the candle structure to agree, such as a higher low forming at a level price has respected before.
- Define the trade before you click. Set your entry, your stop below the recent swing low, and your target before you commit. Risk a fixed, small percentage of the account on the idea.
- Manage the exit. A common approach is to scale out or exit as the RSI approaches the opposite extreme near 70, where upside momentum is stretched.
The mirror image applies for shorts in a range: an RSI move above 70 that then crosses back below it, with price rejecting a known level, is your short condition. These RSI trading signals are entries you confirm, not alerts you chase. The structure around the signal decides whether it is worth taking.
A short observation from years of watching this play out: most traders do not need more signals. They need fewer and better ones. The RSI generates plenty of readings every session. The skill is in ignoring most of them and acting only when momentum, structure, and your risk plan all point the same way.
Divergence: when price and the RSI disagree
Divergence is the highest-quality signal the RSI offers, and it is worth learning early. It happens when price and the indicator disagree about momentum.
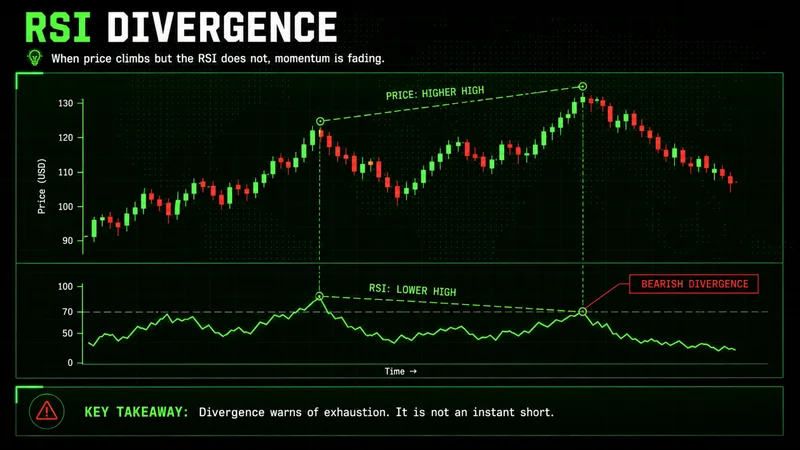
There are two forms, and they mirror each other:
- Bearish divergence forms when price prints a higher high but the RSI prints a lower high. Price is still pushing up, but the momentum behind the move is fading. It is an early warning that an uptrend may be tiring.
- Bullish divergence is the reverse. Price makes a lower low while the RSI makes a higher low, hinting that selling pressure is drying up and a downtrend may be losing force.
In both cases the message is the same: the move and the momentum behind it no longer agree. That disagreement is what gives divergence its predictive value, and also why it needs patience to trade.
Divergence is an RSI reversal strategy in the sense that it flags potential exhaustion, but the word "potential" is doing real work. A divergence can persist for several swings before price actually turns, and in a powerful trend it can resolve with no reversal at all. Use it as a reason to tighten risk or watch for a structural break, not as a standalone short or long. The signal tells you momentum is weakening. It does not tell you the exact bar the reversal arrives.
Where the overbought sell rule quietly fails
This is the part most beginner guides skip, and it is where most of the damage happens. In a strong uptrend, the RSI can stay pinned above 70 for an extended stretch while price keeps climbing. Overbought does not mean expensive, and it does not mean a top is in.
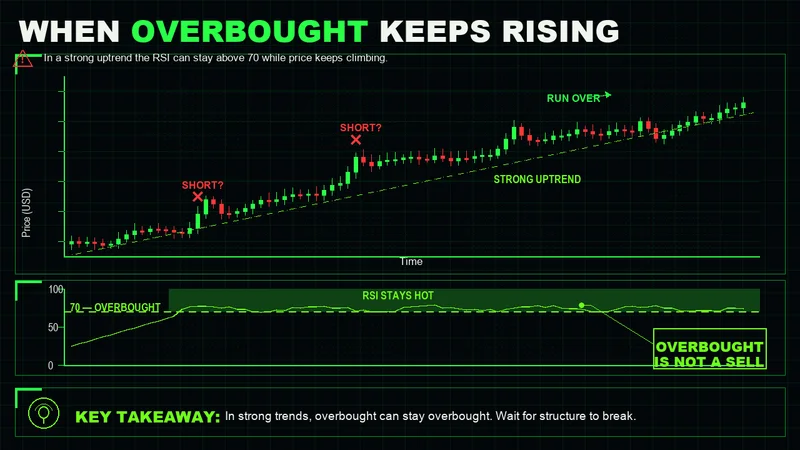
A trader who mechanically shorts every overbought reading during a trending move gets run over again and again. Each short looks reasonable in isolation, then price grinds higher and the loss compounds. The strongest part of many moves happens while the RSI is above 70, because that is exactly what sustained buying pressure looks like on the indicator.
The condition where the oversold and overbought rule works is a balanced, ranging market with no strong directional pressure. The same rule inverts the moment a real trend takes hold: in an uptrend you want to use oversold dips toward the midline as potential entries with the trend, not overbought readings as shorts against it. Before you act on a 70 or a 30, the first question is always whether the market is ranging or trending. The answer changes the entire strategy. An indicator reading without that context is gambling with better vocabulary.
How to confirm RSI signals with structure
The fix for false signals is not a better setting. It is confirmation. The RSI confirmation step is what separates a coin-flip entry from a high-probability one, and it is the habit that protects a beginner account more than any threshold tweak.
Pair the RSI with support and resistance. An oversold reading that lines up with a support level price has defended before is far stronger than an oversold reading floating in the middle of nowhere. The level gives the trade a place to be wrong, which means a clean invalidation and a defined risk. The RSI tells you momentum is stretched; the level tells you where the reaction is likely to happen.
A few ways to confirm before you act, and to avoid false RSI signals:
- Require a level. Only take oversold longs near support and overbought shorts near resistance, not in open space.
- Wait for the cross back. Let the RSI exit the zone before entering, rather than catching a falling line.
- Check the higher timeframe. If the trend on a larger chart is strongly up, fade it cautiously or not at all.
- Demand price agreement. A rejection wick, a higher low, or a clear structure shift turns a reading into a setup.
Confirmation costs you some entries. That is the point. The trades you skip are usually the low-quality ones that would have cost more than they returned.
Common RSI mistakes beginners make
The common RSI trading mistakes beginners make are predictable, and avoiding them is most of the battle:
- Treating 70 as an automatic sell and 30 as an automatic buy, with no regard for whether the market is ranging or trending.
- Shorting strength in an uptrend because the RSI is overbought, then averaging into the loss.
- Trading the RSI in isolation, with no level, no structure, and no defined invalidation.
- Over-optimizing the settings, hunting for a period that would have caught the last move instead of learning the default.
- Acting on every signal, mistaking activity for progress, when patience is the actual edge.
Indicators are tools, not decision-makers. The RSI is one of the better ones because it answers a single question clearly, but it still needs a trader with a plan behind it. Master the default 14-period setting, read the scale as momentum context, confirm every signal against structure, and respect the conditions where the strategy breaks. That is a complete, durable RSI trading strategy for beginners, and it will outlast any setup that promises certainty.
FAQs
What is an RSI trading strategy in simple terms? It is a method that uses the relative strength index, a 0-to-100 momentum line, to improve the timing of trades. Rather than buying or selling on the reading alone, you use overbought and oversold conditions to confirm entries you already have a structural reason to take.
What are the best RSI settings for beginners? Start with the default 14-period setting and the standard 30 and 70 levels. It reacts at a sensible speed and is the most widely tested configuration. Adjust the period or widen the levels to 20 and 80 only after you understand how the default behaves on your market.
Does the RSI work better for buying or selling? It works in both directions, but only when matched to the market condition. In a ranging market, oversold readings near support and overbought readings near resistance are useful. In a strong trend, overbought can persist, so fading it mechanically is where beginners lose the most.
What is RSI divergence and is it reliable? Divergence is when price makes a new high or low but the RSI does not, signaling fading momentum. It is the indicator's strongest signal, but it flags potential exhaustion rather than a precise turn. Treat it as a reason to manage risk and watch for a structural break, not as an instant entry.
Can I use the RSI on its own? You can, but it is not advisable for a beginner. The RSI gives the cleanest results when confirmed by support and resistance, higher-timeframe context, and price structure. Used alone it produces frequent false signals; used as a confirmation filter it removes low-quality trades.
Worth the read?


