R Multiple in Trading — What It Really Measures
An R multiple measures a trade's result in units of risk, not dollars. Here is what it really tells you and where the math quietly breaks down.
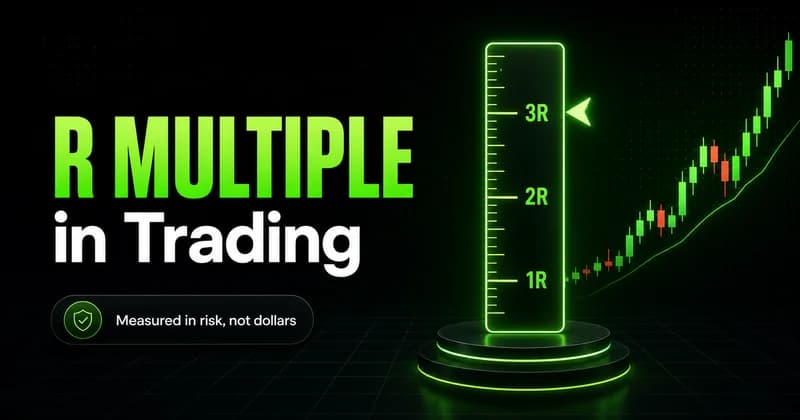
An R multiple measures a trade's result in units of the risk you took, not in dollars. One R is the distance from your entry to your stop. Risk that amount to make three times as much, and a winning trade books a 3R result. Reported this way, every trade speaks the same language, which is the point. The R multiple converts a noisy account curve into a clean series of numbers you can compare across instruments, sizes, and conditions, because most traders track profit and loss but few track what they risked to get it.
What an R multiple actually measures
Start with the R multiple meaning, because the term gets used loosely. R is your initial risk on a single trade, defined before you enter: the gap between your entry and your stop, multiplied by your position size, fixed the moment you commit. A trade that returns twice that risk is a 2R win; a trade that hits the stop is a minus 1R loss. The dollar figure changes with account size and instrument; the R value does not.
This is why R multiple trading basics start with the stop, not the target. If you cannot define where you are wrong, you cannot define one R, and without one R there is no multiple to measure.
The formula and a worked example
The math is simple: R multiple equals profit or loss divided by initial risk. Here is an r multiple example with round numbers.
You buy a stock at 100 and set your stop at 95. Your risk per share is 5, so one R is 5. You exit at 115, a gain of 15 per share, which is 15 divided by 5, or 3R. The same trade stopped out at 95 is a minus 1R loss, whatever the share count.
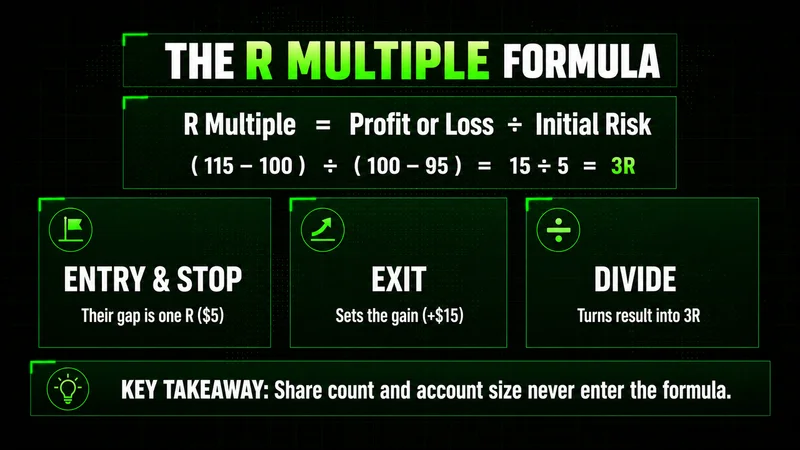
To put any trade in R terms, you need three things:
Your entry and stop, which together define one R.
Your exit, which sets the gain or loss.
The division, which converts the result into a multiple.
Share count and account size never enter the formula. A 3R win on a small position and a 3R win on a large one are the same quality of trade. How much of the account one R represents is a separate decision.
R multiple versus the risk reward ratio
People treat these as the same thing. They are related but answer different questions, and the r multiple vs risk reward ratio distinction is worth holding clearly.
The risk reward ratio is a plan: before the trade, the reward you are targeting against the risk you are accepting, a 3-to-1 target on a defined stop. The R multiple is the result, what you actually realized once the trade closes, often less than the plan because price rarely delivers the full target.
So the ratio describes intent, and the R multiple describes outcome. A trader can plan 3-to-1 setups all day and still average 0.8R if targets get cut short or stops widen mid-trade. Tracking both shows the distance between plan and reality, where most of the work lives.
Why the distribution matters more than any single trade
A single R multiple tells you almost nothing. A series tells you whether you have an edge, and this is where an r multiple strategy moves from definition to practice.
Log fifty trades in R and you can see your average R, your win rate, and how the two combine. A system that wins 40% of the time at a 2.5R winner and a 1R loser is profitable. A system that wins 70% but lets losers run to 2R quietly bleeds out. The win rate hides this; the distribution exposes it.
Most traders do not have a strategy problem. They have a discipline problem, and the R distribution is where that shows up first.
A clean R record usually reveals that the profit came from a small number of high-quality setups, not constant participation. When forced trades during low-quality conditions dominate the distribution, the average R drifts toward zero no matter how good the best trades looked.
Where R multiple thinking breaks down
R multiple math assumes your stop is your risk. In live conditions, that assumption fails more often than the textbooks admit, and pretending otherwise is one of the real r multiple risks. Your defined one R holds only while your stop fills at your stop. On a gap through the level, a thin overnight session, or a fast macro-driven move, the fill comes worse than planned. A minus 1R loss becomes a minus 2R loss, and the number you logged was never the number you took. Gold trades technically for hours, then invalidates the whole move within minutes when volatility expands.
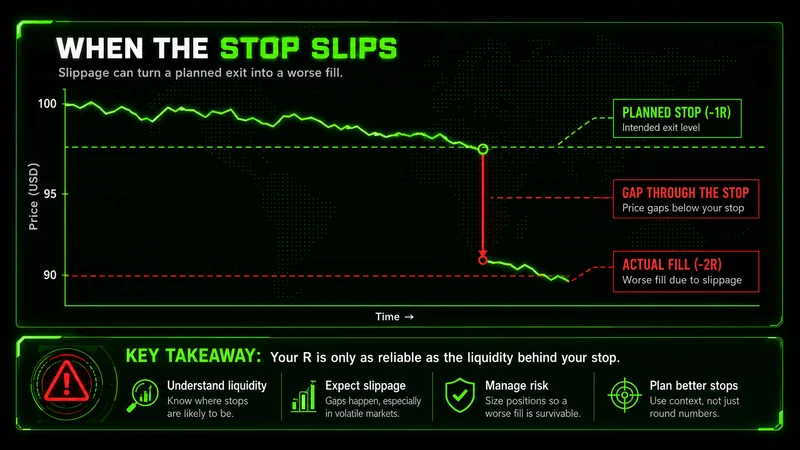
R is an accounting tool, not a guarantee, and only as reliable as the liquidity behind your stop. Treat the planned R as the best case for your downside, and size for a stop that slips past it.
The mistakes that quietly distort your R
The common r multiple mistakes beginners make rarely involve the formula. They involve what gets fed into it. Moving the stop after entry is the most expensive: widening a stop to avoid a loss redefines one R after the fact, so the logged minus 1R is fiction. Cutting winners early is the inverse problem, capping the distribution on the right while the left stays open. Both quietly flatten the average the whole system depends on. A subtler version is mixing conditions without context, since a 2R on a quiet range day and a 2R on a volatility expansion are not the same trade even when the number is identical.
A short checklist before you log a trade in R
Use this r multiple checklist for new traders to keep the data honest. If you cannot answer each item, the R you record will mislead you later.
Was the stop defined before entry, and did it stay there? A stop moved mid-trade voids the one R you started with.
Did the stop fill near the planned level, or did slippage push it past?
Is the exit recorded against the original risk, not a stop you walked behind price?
Did you tag the market condition? Quiet and expansion belong in different buckets.
Are you reviewing the distribution over a sample, not reacting to the last trade?
What the R multiple gives you
The R multiple measures trading in the only unit that stays constant across every position you take. It standardizes results, separates a real edge from a lucky streak, and exposes the gap between the trades you planned and the trades you took. It will not protect you from a stop that fails to fill, and it will not turn a forced trade into a good one. Used honestly over a sample, it tells you whether the process is worth repeating.
Worth the read?