Win Rate in Trading — What It Really Tells You
Win rate in trading is how often you win, not how much. Learn the formula, what a good win rate really is, and why it only matters next to risk and reward.
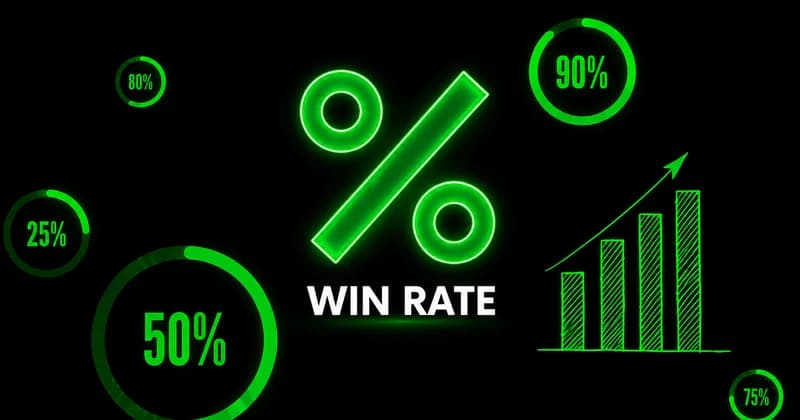
Win rate in trading is the percentage of your trades that close in profit. Take the number of winning trades, divide by the total number of trades, and multiply by 100. That single number tells you how often you were right. It tells you nothing about how much you made when you were right or how much you lost when you were wrong, which is exactly why so many traders read it backward.
A 70% win rate sounds like a finished argument. It is not. A trader who wins seven trades out of ten and loses more on the three losers than he made on the seven winners is still down. Win rate is one input to your edge, not the edge itself. Read in isolation, it is one of the most misleading numbers on your statement.
What win rate actually means
The win rate meaning is narrow on purpose. It measures frequency of correctness and nothing else. If you placed 40 trades and 24 closed green, your win rate is 60%. The metric does not know whether those 24 wins were scratch trades that barely cleared commissions or full runners that paid for the month.
That narrowness is the point. Win rate answers one question cleanly: how often does this approach produce a winning outcome? The mistake is treating that answer as a verdict on profitability. It is closer to a description of the shape of your results than a measure of their quality.
A high number can mean you have a genuine high-probability environment. It can also mean you are cutting winners early and letting losers run, which inflates the count of green trades while quietly draining the account. The number alone cannot tell you which one you are looking at. The trade log around it can.
The win rate formula and how to calculate it
The win rate formula is straightforward:
Win rate = (winning trades / total trades) x 100
The win rate calculation has only two requirements, and both are about discipline rather than math.
Count every closed trade, including the small ones you would rather forget. Selective accounting produces a flattering number that describes a trader who does not exist.
Define a "win" the same way every time. A trade that closes one tick green is a win by this metric. Decide whether scratches count before you start, then stay consistent.
Here is a win rate example. You take 50 trades in a month. 32 close in profit, 18 close at a loss. Your win rate is 32 divided by 50, times 100, which is 64%. That is the whole calculation. The work that matters happens after it, when you place that 64% next to the size of your average win and average loss.
Why a high win rate can still lose money
This is the part most explanations skip. Win rate and average trade size move independently, and the relationship between them decides whether you survive.
Consider two traders over 100 trades each.
Trader | Win rate | Avg win | Avg loss | Net result |
|---|---|---|---|---|
A | 70% | $40 | $120 | losing |
B | 40% | $300 | $100 | winning |
Trader A is right far more often and still bleeds, because each loss erases three wins. Trader B is wrong most of the time and compounds steadily, because the wins are large enough to carry the losses. The win rate told you who was correct more often. It told you nothing about who was profitable.
This is why win rate has to be read alongside the average size of your wins relative to your losses. A 40% win rate paired with wins that are three times your losses is a strong, durable edge. A 65% win rate paired with losses larger than your wins is a slow blowup. Most traders are overleveraged without realizing it, and a flattering win rate is one of the things that hides the problem until a normal losing streak exposes it.
What is a good win rate, and why the benchmark is conditional
There is no universal good win rate, and any win rate benchmark that ignores your average win and loss is close to useless. The honest answer is that a good win rate is whatever keeps your expectancy positive given how large your winners are relative to your losers.
That said, ranges exist by style, because different approaches accept different distributions of wins and losses.
Scalpers and high-frequency setups often run higher, in the 55% to 70% range, because they take small, frequent profits and need correctness to outrun costs.
Swing and intraday discretionary trading commonly sits between 45% and 55%.
Trend-following and momentum approaches frequently win less than half the time, sometimes 35% to 45%, and rely on a small number of large winners to carry the year.
A 40% win rate is excellent for a trend follower and a disaster for a scalper. The number only has meaning once you anchor it to the style that produced it and the risk-reward that style runs.
Win rate is one input to expectancy, not the whole edge
If you only track one thing, track expectancy instead. Expectancy is the average amount you can expect to win or lose per trade, and win rate is one of its two ingredients. The other is the ratio of your average win to your average loss. Win rate vs expectancy is not a competition; expectancy is what win rate is supposed to feed into.
The reason this matters in practice is that it changes what you do during a drawdown. A trader watching only win rate panics when it dips, tightens up, and starts cutting good trades to manufacture more green days. A trader watching expectancy can see that a lower win rate paired with larger winners is still a positive system, and holds the process steady.
This is also why win rate matters in risk management. Your position size should reflect the real distribution of outcomes, not the comforting headline. If your edge wins 45% of the time, you will see losing streaks of four, five, and six trades inside a normal year. Sizing as if you win two out of three is how a routine cold streak turns into an account-threatening one.
A practical review workflow keeps all of this in one place:
Log every trade with entry, exit, and the planned invalidation, not just the result.
Compute win rate, average win, and average loss together at the end of each week.
Read expectancy as the headline number; treat win rate as a diagnostic underneath it.
Flag any week where win rate moved sharply but expectancy did not, then check whether you changed your behavior or the market changed its character.
When win rate benchmarks stop being meaningful
Every benchmark you have read assumes two things that are often false: a large enough sample, and a stable market regime. Break either one and the number stops describing anything.
A win rate measured over 15 or 20 trades is noise. You need a sample large enough that a single streak does not swing the percentage by ten points. A trader who declares a 70% win rate after three weeks is reporting variance, not edge. The same is true of a trader who abandons a sound approach after a 30% week.
Regime is the subtler trap. A win rate is a measurement taken inside a particular set of conditions. A mean-reversion approach can post a high win rate for months while the market chops inside a range, then have that number collapse the moment volatility expands and price starts trending cleanly through old levels. The strategy did not get worse. The environment changed, and the benchmark you carried over from the quiet period no longer applies. No strategy works in all market conditions, and a win rate carried from one regime into another is one of the easiest ways to be confidently wrong about your own edge.
Common win rate mistakes and how to improve
The most common win rate mistakes are not math errors. They are interpretation errors.
Chasing the number. Moving stops wider and taking profit early both raise the win rate while damaging expectancy. The statement looks better and the account looks worse.
Reading too small a sample and treating it as proof.
Comparing your win rate to a style that is not yours.
Ignoring how your wins compare to your losses, which is the variable that actually decides whether the win rate is good or bad.
Win rate improvement that is real comes from the process, not from gaming the metric. Take trades only when structure, liquidity, and broader context line up, and the quality of your entries rises on its own. Define invalidation before you enter so losers stay small and consistent. Keep the sample honest by logging everything. The point is not to push the percentage higher; it is to understand which percentage your approach should produce and then execute that approach cleanly. Discipline over frequency is what moves the number in a way that survives.
FAQs
What is win rate in trading in simple terms? It is the percentage of your trades that close in profit, calculated as winning trades divided by total trades, times 100. It measures how often you are right, not how much you make when you are right.
How do I calculate my win rate? Divide your number of winning trades by your total number of closed trades and multiply by 100. The only discipline required is counting every trade and defining a win the same way each time.
What is a good win rate for new traders? There is no single good number. A win rate is only good if it keeps your expectancy positive given the size of your average win versus your average loss. Many profitable traders win fewer than half their trades because their winners are larger than their losers.
Can you be profitable with a low win rate? Yes. A trader who wins 40% of the time but makes three times as much on winners as he loses on losers is profitable. Win rate alone never decides the outcome; it has to be read alongside risk and reward.
Worth the read?