
Return on Sales — What the Ratio Really Tells You
Return on sales is operating profit divided by revenue. Here is how to calculate it, read the number in context, and avoid the comparisons that mislead.

Return on sales is operating profit divided by revenue, expressed as a percentage. It answers one question: of every dollar a company sells, how much survives as operating profit after the cost of running the business. A company posting 12% keeps twelve cents of operating profit on each dollar of sales. That is the whole definition, and most explanations stop there. The number is easy. Reading it correctly is the part that takes work.
The ratio gets sold as a sales-team scorecard. It is more useful as a profitability-quality check on a company you are trying to understand. The figure is honest about efficiency and quiet about everything else, so the discipline is knowing what it leaves out.
What return on sales actually measures
Return on sales meaning, in plain terms, is operational efficiency. It isolates the profit a business generates from its core operations before the financing and tax decisions layered on top. Interest expense, tax rates, and one-time gains sit outside the ratio. What remains is a clean read on how well the company converts revenue into operating profit.
That focus is the strength. Two companies with identical revenue can run very different cost structures, and return on sales surfaces the gap immediately. The one keeping more of each sales dollar is operating leaner, assuming the accounting is comparable. The assumption is doing a lot of work in that sentence, and we will come back to it.
The return on sales formula and a worked example
The return on sales formula is straightforward:
Return on Sales = (Operating Profit / Net Sales) x 100
Operating profit is revenue minus the cost of goods sold and operating expenses, before interest and taxes. Net sales is total revenue after returns, allowances, and discounts. The return on sales calculation is the division, then a multiplication by 100 to read it as a percentage.
A return on sales example makes it concrete. Suppose a company reports the following for the year:
Net sales: 5,000,000
Cost of goods sold: 3,000,000
Operating expenses: 1,400,000
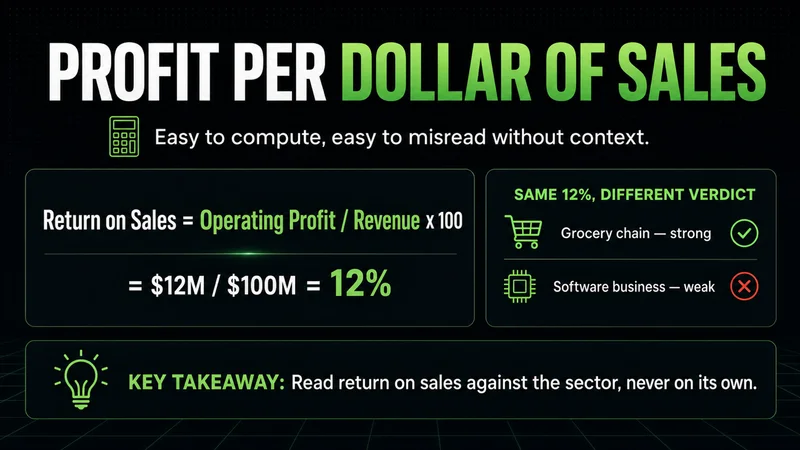
Operating profit is 5,000,000 minus 3,000,000 minus 1,400,000, which equals 600,000. Divide 600,000 by 5,000,000 and multiply by 100. The result is 12%. The company keeps twelve cents of operating profit on every dollar of sales. That single figure now becomes the input to the harder question, which is whether 12% is good.
How to read the number once you have it
Return on sales interpretation depends entirely on context. A figure in isolation tells you almost nothing. The 12% above is strong for a grocery chain and weak for a software business. This is why the return on sales benchmark conversation has to be sector-specific. A common rule of thumb treats anything above 5% as decent and anything above 10% as healthy, but that rule breaks the moment you compare across industries.
Three comparisons make the number useful:
Against the company's own history, to see whether efficiency is improving or eroding
Against direct competitors with similar business models and cost structures
Against the sector median, which sets the realistic ceiling and floor for the business type
A rising return on sales over several years is usually the signal that matters more than the absolute level. It suggests the business is gaining operating leverage as it grows. A flat-to-falling figure during rising revenue is the opposite signal, and it deserves more attention than a single strong year.
Return on sales vs. net profit margin
The return on sales vs net profit margin distinction trips up a lot of beginners, because both are profit divided by sales. The difference is which profit. Return on sales uses operating profit, before interest and taxes. Net profit margin uses net income, after everything, including financing costs and taxes.
That makes return on sales the cleaner read on operations. Net profit margin can be dragged down by a heavy debt load or pushed around by a favorable tax year, neither of which says anything about how well the company actually runs. When you want to compare the operational quality of two businesses with different capital structures, return on sales strips out the noise that net profit margin carries. When you want the bottom line a shareholder ultimately keeps, net profit margin is the right tool.
Where return on sales quietly misleads you
Return on sales limitations are where the ratio earns its caveats, and they are easy to ignore. The metric reads cleanly when two companies share a business model and consistent accounting. Outside those conditions, the same comparison can mean almost nothing.
The distortions show up in a few predictable places:
Capital intensity. A factory-heavy manufacturer and an asset-light software firm cannot be judged on the same return on sales scale. Different cost structures produce different ranges by design.
One-time items. A large asset sale or a restructuring charge can inflate or crater operating profit for a single period, making the ratio temporarily meaningless.
Accounting choices. Depreciation methods and how costs are classified between operating and non-operating lines shift the numerator without changing the underlying business.
This is the part worth internalizing. Return on sales is a snapshot of operating efficiency under stable conditions. Stress those conditions, and the framework inverts. The same number that looked like a clean comparison becomes a trap when one company just sold a division and the other did not.
A ratio is a question, not an answer. The number tells you where to look next, not what you have found.
What does return on sales tell investors?
For someone analyzing a company rather than running a sales floor, return on sales is a probe into profitability quality. It tells investors how durable the operating profit is and how much room the business has to absorb a bad quarter. A high, stable return on sales suggests pricing power and cost control. A thin or volatile one suggests the company is exposed when conditions tighten.
The discipline is the same one that matters in markets generally. Context comes before the conclusion. A single ratio without the surrounding business model, the sector, and the trend is closer to a guess than an analysis. Most beginners treat the number as the verdict. The experienced reader treats it as the first question and keeps going. The metric points you toward the income statement; it does not replace reading it.
Reading return on sales without fooling yourself
Return on sales is a clean, fast read on operating efficiency, and it is only as good as the comparison you build around it. Used in isolation, it invites false confidence. Used against history, peers, and sector norms, it becomes a reliable filter.
If you are working it into a stock analysis routine, a short checklist keeps you honest:
Confirm you are using operating profit, not net income, in the numerator
Compare only against similar business models and the same sector
Check the multi-year trend, not a single period
Flag any one-time items or accounting changes before drawing a conclusion
For the broader context this metric lives in, the natural next reads are operating margin, net profit margin, and how the full income statement fits together when you judge a company's profitability.
Worth the read?


