
Support and Resistance Zones — How to Read Them Right
Support and resistance zones are price bands where momentum gets absorbed, not single lines. Here is how to read, draw, and trade them right.
Support and resistance zones are price areas where buying or selling has repeatedly absorbed momentum, not single lines on a chart. Support is the band where price tends to stop falling because demand shows up. Resistance is the band where price tends to stall because supply shows up. The word that matters is band. Price reacts to a region, not a number, and treating that region as a hard line is where most beginners lose the read.
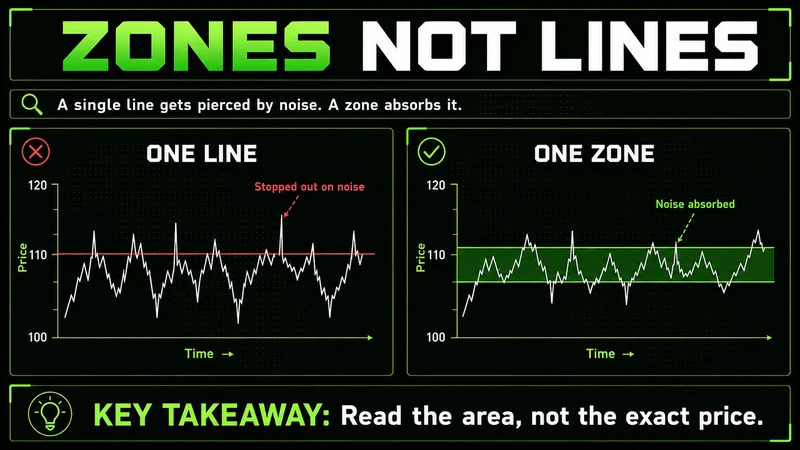
Most traders draw one line and defend it like a wall. The market does not work that way. A level gets tested, wicks through, snaps back, and the trader who drew a single price gets stopped out on noise that the zone would have absorbed. Reading these areas as zones is not a stylistic choice. It is closer to how order flow actually behaves around prior reaction points.
What support and resistance zones actually are
A support and resistance zone is a price region where the market has reacted more than once. Buyers stepped in there before. Sellers leaned on it before. Because participants remember those reactions, and because resting orders cluster around them, price tends to respond again when it returns.
That is the meaning behind the term. Support is demand-side memory. Resistance is supply-side memory. Neither is a guarantee. Both are conditions that raise or lower the probability of a reaction, and probability is the only thing technical analysis ever deals in.
Why these regions form is worth understanding, because it tells you when to trust them and when not to. Three forces stack up at a prior reaction point. First, resting orders. Traders who missed the last bounce leave limit orders waiting for a return, and those orders concentrate near the old reaction. Second, memory. Participants who got hurt or rewarded at a price watch for it to return and act when it does. Third, round numbers. Whole figures pull orders toward them for no structural reason beyond psychology. When all three line up in the same region, the zone carries real weight. When only one is present, it is thinner than it looks.
There is a second idea worth holding from the start. When price breaks through a zone with conviction, the roles often flip. Old resistance becomes support. Old support becomes resistance. Traders call this polarity, and it is one of the few price-action concepts that holds up across markets and timeframes. A zone that capped three rallies, once broken and accepted above, frequently becomes the floor for the next pullback.
Zones versus levels — the distinction that changes your entries
The difference between zones and levels is not academic. It decides where you place risk.
A level is a single price. A zone is a band with an upper and lower edge. The reason zones win is mechanical. Reaction points are rarely exact. One test prints at 4,512, the next at 4,508, the next at 4,515. Draw a line at any one of those and the other two look like failures. Draw a band that contains all three and the structure reads cleanly.
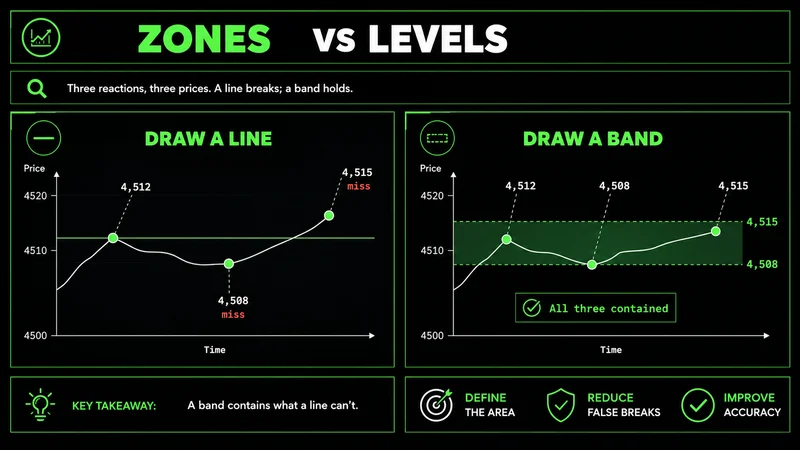
The practical consequence is risk placement. If you treat a zone as a line, your stop sits inside the noise, and you get taken out on a wick that means nothing. If you treat it as a band, your invalidation sits beyond the far edge, where a break actually says the read was wrong. The zone gives you a defined invalidation that respects how price behaves rather than how you wish it behaved.
This is the support and resistance zones versus support and resistance levels question, settled in one sentence: levels tell you roughly where to look, zones tell you where to act and where to be wrong.
There is a place for both. A horizontal level is a fine first pass when you are scanning a chart quickly, because it marks the rough area to watch. The moment you are about to commit risk, that level needs to become a band. The conversion is simple: take the single price you drew, then widen it to cover the spread of the actual wicks and closes that printed around it. What you are doing is replacing a guess about where price should turn with a record of where it has turned. The level is the headline; the zone is the detail you trade on.
How to identify support and resistance zones on a chart
Identifying a zone is a process of finding repeated reactions and drawing the band that contains them. Here is the sequence I use.
Zoom out first. Load enough history to see major turning points. On an intraday chart that means several weeks of context; on a swing chart, several months. Structure you cannot see is structure you will trade into blind.
Mark the obvious swing highs and swing lows. These are the points where price made a clear turn and left a peak or a trough. They are the raw material for every zone.
Look for clusters, not isolated touches. A single reaction is a maybe. Two or more reactions in the same region is a zone. The more independent tests a region has survived, the more weight it carries.
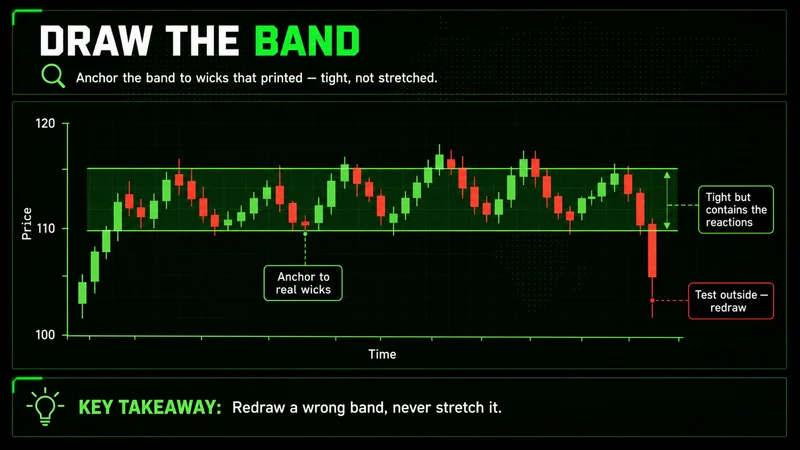
Draw a rectangle, not a line. Anchor the upper edge to the highest reaction wick in the cluster and the lower edge to the lowest body or wick that defines the region. The band should contain the reactions, not bisect them.
Note round numbers. Whole figures like 100, 4,500, or 20,000 attract orders for no reason other than that they are round. When a swing cluster lines up with a round number, the zone is stronger.
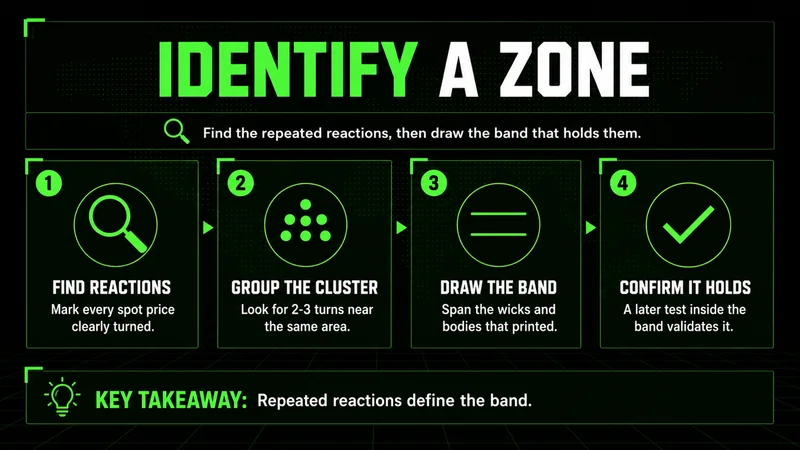
A quick support and resistance zones chart example makes this concrete. Say an index futures contract rallies to 4,520, sells off, rallies again to 4,516, sells off, then taps 4,524 and rolls over. Three rejections, all within eight points. That is not three failed levels. That is one resistance zone running roughly 4,516 to 4,524, and the next time price approaches it, you already know where supply lives.
How to draw the band so it holds up
Drawing the zone well is mostly about restraint. The temptation is to make the band wide enough that price always reacts somewhere inside it, which feels safe and means nothing. A zone that is too wide is just a guess wearing a rectangle.
Keep the band tight enough to be useful and wide enough to contain the real reactions. Anchor it to wicks and bodies that actually printed, not to where you expected price to turn. If a fourth test prints well outside your band, the band was wrong, and you redraw it rather than stretching it to fit.
Higher-timeframe zones override lower-timeframe ones. A daily resistance band matters more than a five-minute band sitting just below it. When the two conflict, the higher timeframe wins, because more participants are watching it and more resting orders sit against it. Mark the higher-timeframe zones first, then drop down to refine entries inside them.
There is also a question of how wide a zone should be, and the honest answer is that it depends on the instrument and the timeframe. A volatile index future like NQ leaves wider reaction bands than a slow, range-bound stock, because the average bar covers more ground. Let the asset set the width. Measure the spread of the actual reactions and let that define the band, rather than imposing a fixed number of points or ticks on every chart you open. The same eight-point band that is tight on an index can be far too loose on a quiet equity.
Confirmation — what to wait for before entering
A zone is a location, not a signal. Price reaching a support and resistance zone tells you where to pay attention. It does not tell you to enter. The support and resistance zones confirmation step is where most of the edge actually lives.
Confirmation means waiting for price to show a reaction at the zone before committing risk. The market is reactive, not predictive, and so is good execution. A few things I want to see before treating a zone as live:
A clear rejection candle. A long wick into the zone that closes back out shows the zone is being defended.
A shift in momentum. Price slowing, stalling, then turning is more reliable than price arriving and reversing in a single bar.
Acceptance or rejection, decided. Either price rejects the zone and leaves, or it breaks through and holds. Both are tradable. What is not tradable is the moment of arrival, before the market has shown its hand.
The market does not owe you a reaction at any level. It only shows you, after the fact, whether participants defended it. Your job is to wait for that answer, not to guess it.
How to confirm support and resistance zones before entering a trade comes down to patience. Entering on touch is hoping. Entering on reaction is reading. The difference between the two is the difference between most blown accounts and most surviving ones.
A simple zone trading strategy
The support and resistance zones trading strategy that works for most people is the least complicated one. Buy reactions at support inside an uptrend. Sell reactions at resistance inside a downtrend. Define risk beyond the far edge of the zone. Manage the trade toward the next opposing zone.
The steps, in order:
Identify the broader trend first. A zone in the direction of the trend is a higher-probability environment than a zone fighting it.
Wait for price to reach a zone aligned with that trend.
Wait for confirmation, as described above. No reaction, no trade.
Place the stop beyond the opposite edge of the zone, where a break invalidates the idea.
Target the next zone in the direction of the trade, and manage as price approaches it.
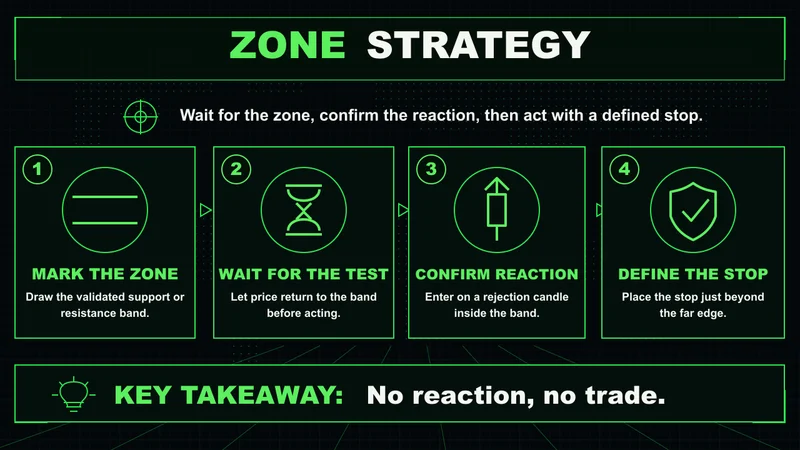
Notice what this strategy does not include. No prediction of where price will go. No conviction that the zone must hold. Just a defined location, a confirmation requirement, a defined invalidation, and a target. Trading without that structure is gambling with better vocabulary.
The same zones can be traded a second way, on the break rather than the bounce. When price pushes through a resistance zone and then comes back to retest it from above, that old resistance often acts as support. The retest is frequently a cleaner entry than chasing the initial break, because the break itself can be a trap and the retest forces the market to prove that polarity has flipped. Either approach works. What does not work is switching between them mid-trade because price moved against you. Pick the read before the entry, define where it is wrong, and let the zone do its job or invalidate.
When support and resistance zones break down
This approach has conditions where it stops working, and pretending otherwise is how people get hurt.
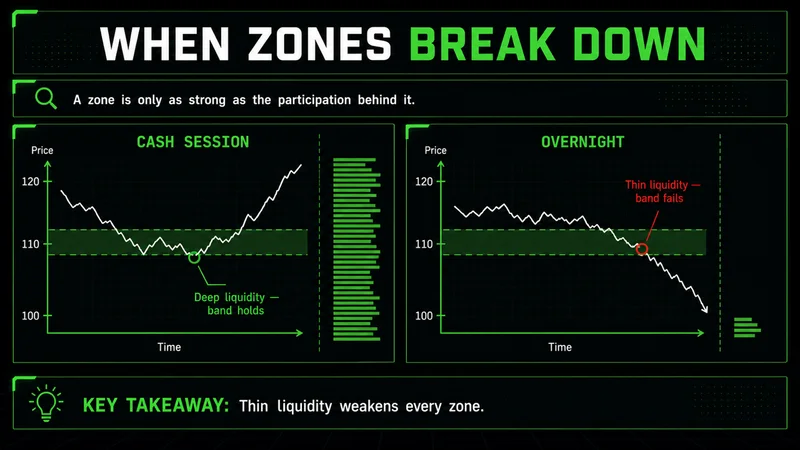
Zones read cleanly during regular cash-session hours, when liquidity is deep and participation is broad. Overnight, on thin liquidity, the same zone means far less. Price can drift through a band that would have held in daytime hours, simply because there are not enough resting orders to defend it. A zone is only as strong as the participation behind it.
Macro-driven volatility breaks zones outright. Around major economic releases or central-bank decisions, price can blow through three zones in a single move without reacting to any of them. Gold respects structure for hours and then invalidates an entire map within minutes when a macro catalyst hits. In those windows, the zones on your chart describe a market that no longer exists. The right response is usually to stand aside until structure reforms, not to keep buying support that is being shredded.
There is also a slower failure mode worth naming. A zone weakens every time it is tested. The first touch carries the most resting orders behind it; by the third or fourth test, much of that liquidity has been absorbed, and the band is more likely to break than to hold. Traders often treat a heavily tested zone as battle-proven when the opposite is closer to true. Repeated tests are the market chewing through the orders that made the zone matter. A level that has held four times is frequently one test away from giving way, not four times stronger.
The lesson is not that zones fail. It is that zones describe normal conditions, and normal conditions do not last all day. Knowing when your framework does not apply is as important as the framework itself.
The best timeframe for support and resistance zones
There is no single best timeframe for support and resistance zones analysis. There is a best practice, which is to read more than one.
Higher timeframes define the zones that matter. The daily and four-hour charts show the bands where the most participants are positioned. Lower timeframes refine the entry inside those bands. A five-minute chart can show you the exact rejection candle, but only inside a zone that the higher timeframe already validated.
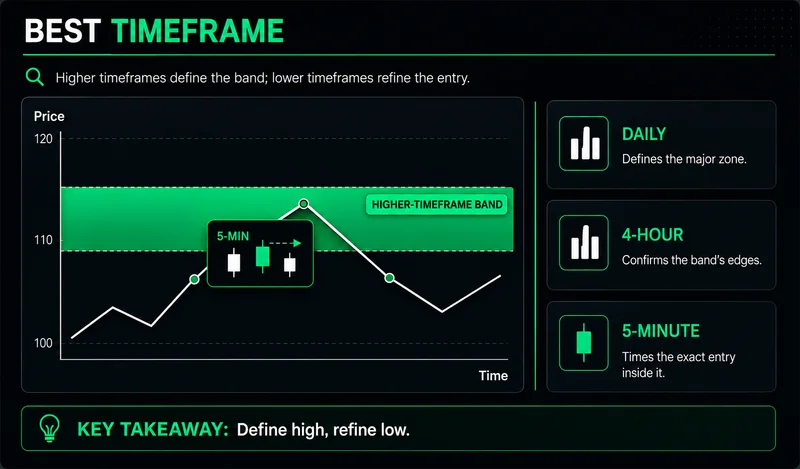
The mistake is using a single low timeframe in isolation. What looks like a clean zone on a five-minute chart is often noise sitting inside a much larger range you cannot see. Read top-down. Let the higher timeframe set the context and the lower timeframe sharpen the execution.
A related point on how this affects risk. Reading more than one timeframe is not just about finding better entries; it is about sizing them correctly. A reaction at a minor five-minute zone deserves a smaller position than a reaction at a daily zone that has held for months, because the conviction behind the two is not the same. When the timeframe of the zone matches the timeframe of your stop and target, the risk you take is proportional to the structure you are reading. When they are mismatched, you end up risking a daily-sized stop on a five-minute idea, or cutting a high-conviction trade on noise. Aligning them is quiet work, but it is most of what separates a survivable approach from a fragile one.
Common mistakes and a checklist for new traders
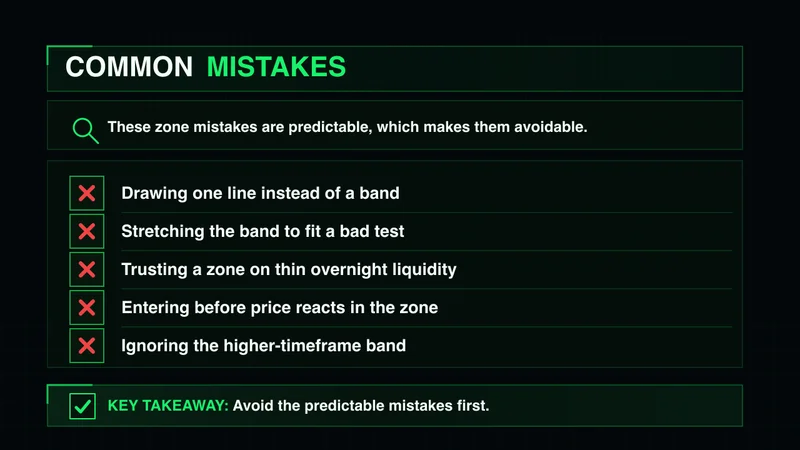
The support and resistance zones mistakes that cost beginners the most are predictable, which means they are avoidable.
Drawing lines instead of zones, then getting stopped on noise inside the band.
Entering on touch instead of waiting for confirmation.
Forcing trades at every zone instead of only the ones aligned with trend and context.
Ignoring the higher timeframe and trading minor zones as if they were major.
Trading through macro events as if the chart still applies.
Widening a zone after the fact to make a losing read look correct.
A short support and resistance zones checklist for new traders, to run before any entry:
Is this zone defined by two or more independent reactions?
Is it drawn as a band anchored to real wicks and bodies, not a single line?
Does it align with the higher-timeframe trend and structure?
Has price shown confirmation at the zone, or am I anticipating?
Is my invalidation beyond the far edge, where a break proves me wrong?
Are conditions normal, or is a macro catalyst about to make the chart irrelevant?
If any answer is no, the trade is lower quality, and waiting is part of the job. A zone you skip costs nothing. A zone you force during low-quality conditions costs real capital, and it usually costs composure on the next setup too.
FAQs
What are support and resistance zones in trading? They are price regions where the market has reacted more than once, support being a band where demand tends to stop declines and resistance being a band where supply tends to stop advances. They are areas, not exact lines, because reaction points rarely print at the same price twice.
What is the difference between support and resistance zones and support and resistance levels? A level is a single price; a zone is a band with two edges. Zones better reflect how price actually reacts to a region, which lets you place your stop beyond the band rather than inside the noise where a wick would knock you out.
How do I confirm a support and resistance zone before entering? Wait for price to react at the zone rather than entering on touch. A clear rejection candle, a visible shift in momentum, or a decisive break-and-hold all count as confirmation. Arrival alone is not a signal.
What is the best timeframe for support and resistance zones? Use more than one. Higher timeframes like the daily and four-hour define the zones that matter, and lower timeframes refine the entry inside them. A single low timeframe in isolation usually mistakes noise for structure.
Why do support and resistance zones sometimes fail? Zones depend on participation. In thin overnight liquidity or during macro-driven volatility around major news, there are not enough resting orders to defend a band, and price can move straight through it. Zones describe normal conditions, and normal conditions do not last all session.
Worth the read?


