
Support Breakout — What It Means and How to Confirm
A support breakout is when price closes through a defended level, turning a floor into a ceiling. Learn how to confirm one before you act.

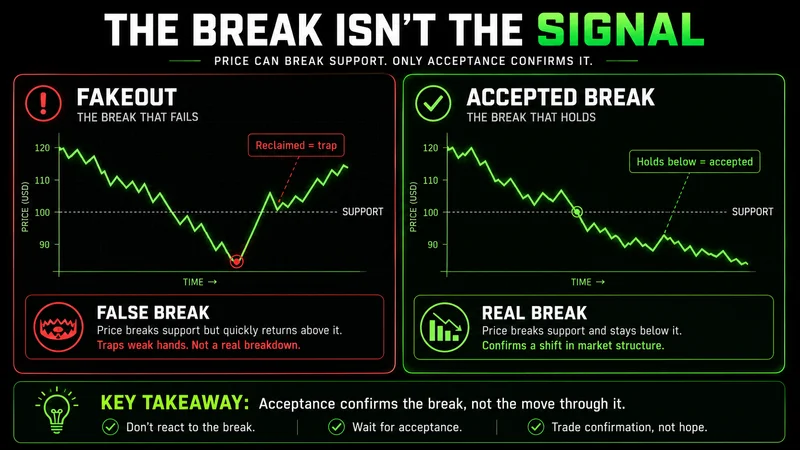
A support breakout happens when price closes through a level that buyers had been defending, turning a floor into a ceiling. It is a structural event, not a single candle, and it only matters once the market accepts the new level. Most traders react to the first break. The ones who survive react to what price does next.
That distinction is the whole article. A support breakout is easy to spot in hindsight and easy to misread in real time. The level breaks, momentum looks obvious, and the entry feels free. Then price reclaims the level, the move was a fakeout, and the position is already underwater. The break was never the signal. Acceptance was.
What a support breakout actually means
Support is a price area where buyers have repeatedly stepped in and stopped a decline. It shows up as a series of swing lows that line up horizontally, or as a rising trendline that price keeps respecting. A support breakout is the moment price pushes through that area and closes beyond it, signaling that the buyers who used to defend the level are no longer in control.
The support breakout meaning that matters in live trading is behavioral, not geometric. The line on the chart is just a record of past decisions. When price breaks it, the market is telling you that the participants who bought there before are either absent, trapped, or already selling. That shift in positioning is the real event. The candle that prints below the level is only the evidence.
This is why a support break is directional in a way that beginners often underestimate. Resistance breaks tend to draw in fresh buyers chasing upside. A support break tends to expose existing longs who are now sitting in a losing position. When those longs give up, their selling adds fuel to the move. The asymmetry is built into the structure.
How to identify a support breakout on a chart
Before you can trade a break, you have to mark the level correctly. Sloppy levels produce sloppy signals. To identify a support breakout on a chart, work through the structure in order:
Find at least two swing lows that reacted from roughly the same price. One touch is an accident; two or more is a level the market is watching.
Draw the support as a zone, not a hairline. Price respects areas, not exact prices, so give the level a few ticks of width.
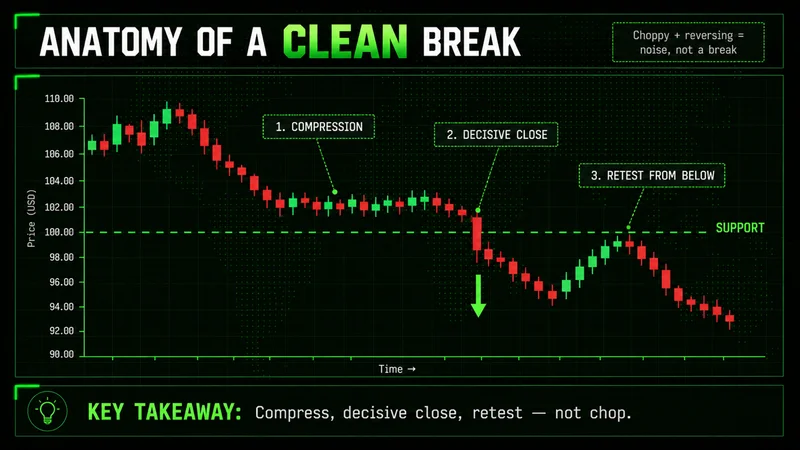
Wait for a candle to close beyond the zone, not just wick through it. A wick is a test. A close is a decision.
Note where the level sits in the broader trend. A support break inside a larger downtrend means something different from one that snaps a long uptrend.
A clean support breakout chart example looks deliberate: price compresses near the level, expands through it with a decisive close, and then either holds below or retests from underneath. If the move is choppy, overlapping, and immediately reversing, you are probably looking at noise rather than a break.
Confirming the breakout before you act
Confirmation is where most of the edge lives. Knowing how to confirm a support breakout before entering a trade is the difference between trading structure and chasing momentum. There is no single indicator that validates a break. Confirmation is a sequence of conditions, and the more of them line up, the higher the probability that the level is genuinely lost.
Three forms of support breakout confirmation carry the most weight:
Candle close beyond the level. Price has to close through the zone on the timeframe you are trading, not merely poke through intrabar. An intrabar break that closes back inside is a rejection, not a breakout.
Volume or order flow expansion. A real break usually carries participation. When price leaves the level with visibly heavier selling and no immediate absorption, that is the market committing. A break on thin, hesitant flow is suspect.
The retest holds as resistance. This is the cleanest tell. Price breaks, returns to the broken level, fails to reclaim it, and continues lower. The old support now caps the move. More on that next.
Waiting for confirmation costs you the first leg of the move. That is the trade-off, and it is worth it. The entries you skip by waiting are the same entries that trap aggressive traders on fakeouts. As MRPNL puts it:
Most breakouts fail because traders enter emotionally instead of structurally. Confirmation is not hesitation. It is the price of not being the liquidity.
Support breakout vs resistance breakout — the asymmetry that matters
Guides usually treat "breakout" as one idea and flip a sign for direction. In practice, support breakout vs resistance breakout is an asymmetry worth understanding, because the two behave differently under the surface.
A resistance breakout moves into territory where sellers are stepping aside and buyers are initiating. The move is driven by demand showing up. A support breakout moves into territory where buyers are stepping aside and trapped longs are getting out. The move is often driven as much by supply being forced out as by fresh sellers arriving.
That changes how the two tend to behave. Support breaks can accelerate sharply once trapped buyers capitulate, because fear liquidates faster than greed accumulates. Resistance breaks often grind higher as buyers add into strength. Neither is better. They simply require different expectations. If you size and manage a support break the way you would a resistance break, the speed of a capitulation move can stop you out before the structure ever invalidates.
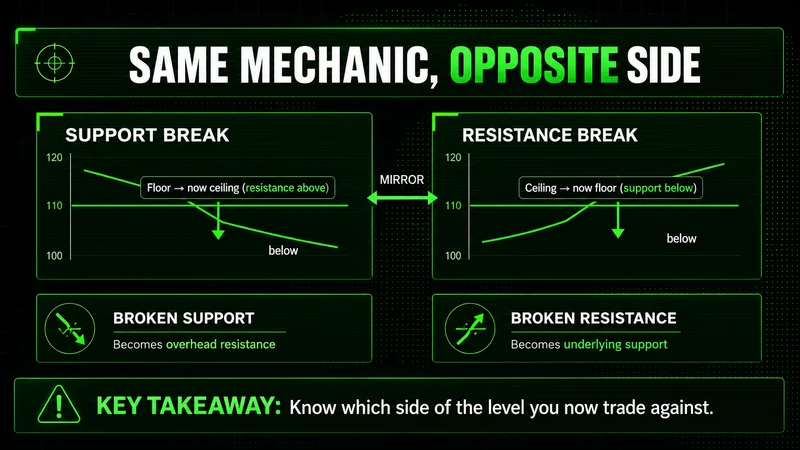
The support breakout vs resistance breakout distinction also matters for the retest. After a support break, the broken level becomes overhead resistance. After a resistance break, it becomes underlying support. Same mechanic, opposite direction. Knowing which side of the level you are now trading against keeps your risk on the correct side.
How broken support flips to resistance on the retest
The retest is the most reliable confirmation a support breakout gives you, and it is the part beginners skip in their rush to be early. When support breaks and price later climbs back to that level, the level often rejects price and sends it lower again. The floor has become a ceiling. This is role reversal, and it is structural, not magical.
The reason is positioning. The buyers who defended the level are now trapped above their entries. Many of them will sell into any bounce that brings price back near break-even, just to escape with a smaller loss. Their selling is exactly what turns the old support into fresh resistance. The retest is the market showing you who is still trapped and how badly they want out.
Trading the retest instead of the initial break gives you two advantages. Your risk is defined and tight, because invalidation sits just above the reclaimed level. And you are entering on confirmation that the new structure is holding, rather than guessing that it will. The cost is patience. The retest does not always come, and when price runs without looking back, you miss it. That is an acceptable price for not being trapped on the breaks that fail.
Building a support breakout trading strategy
A support breakout trading strategy is less about the entry trigger and more about the framework around it. The trigger is the easy part. The framework is what keeps a string of fakeouts from compounding into a drawdown. Risk management matters more than the entry, because a mediocre entry with controlled risk survives while a perfect entry with poor sizing eventually does not.
A simple, repeatable approach has a few fixed pieces:
Context first. Only trade breaks that align with the broader structure. A support break inside an established downtrend has the wind behind it. A break that fights a strong uptrend is fighting the dominant flow.
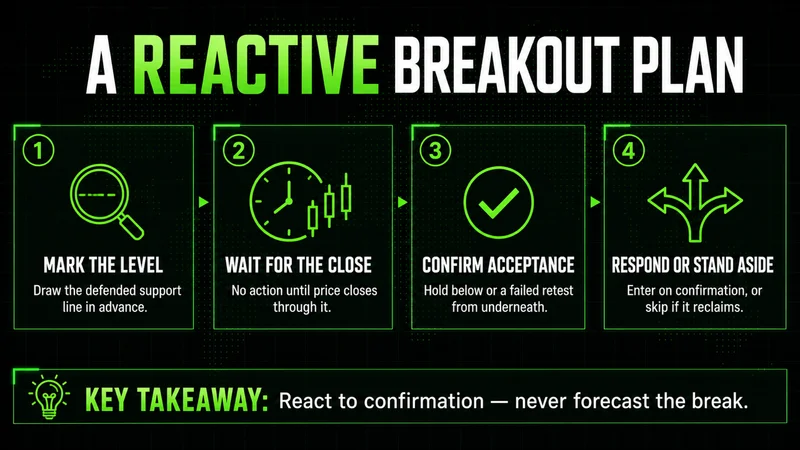
Defined entry. Choose one trigger and hold to it: the confirmed close beyond the level, or the failed retest from underneath. Do not switch triggers mid-trade because price moved without you.
Defined invalidation. Place your stop where the breakout is structurally wrong, usually above the reclaimed level. If price closes back above support with acceptance, the break failed and you are out. No negotiation.
Position size from the stop. Size so that the distance to invalidation is a fixed, small fraction of your account. The stop distance sets the size, never the other way around.
Notice that the strategy says almost nothing about prediction. It is reactive by design. You are not forecasting that support will break. You are prepared to respond cleanly if it does, and equally prepared to stand aside if it does not.
What is the best timeframe for support breakout analysis?
There is no universal best timeframe for support breakout analysis. The right timeframe is the one that matches how long you intend to hold and how much noise you can tolerate. The principle that does carry across all of them is alignment: the level should be visible on a higher timeframe than the one you execute on.
Higher timeframes produce fewer breaks, but the ones they produce carry more weight, because more participants are watching the same level. Lower timeframes produce far more breaks, and a larger share of them are noise that resolves back into the range. A daily support break is a structural event. A one-minute support break during thin overnight liquidity is often just a stop run that means almost nothing.
That last point is where this approach breaks down if you ignore it. The same break sequence that reads cleanly during active cash-session hours can be pure noise overnight on thin liquidity, where a handful of orders push price through a level and right back. The structure looks identical on the chart. The conviction behind it is not. Read the level on a higher timeframe, confirm on your execution timeframe, and treat low-liquidity hours with suspicion.
Common support breakout mistakes beginners make
The common support breakout mistakes beginners make are almost never analytical. They are behavioral. The chart is usually fine. The execution is what fails. The recurring ones:
Entering on the wick instead of the close. Acting before the candle confirms turns every intrabar test into a false signal.
Chasing the move after it has already extended. By the time the break feels obvious, the low-risk entry is gone and the stop has to sit far away.
Ignoring the broader context. A support break that fights the dominant trend is a low-probability trade dressed up as a clean setup.
Skipping the retest out of impatience. The retest is the confirmation, and skipping it to be early is how traders end up holding the fakeouts.
Sizing too large on a structure that has not confirmed. A break that has not held does not deserve full size. Most account damage starts with oversized positions on unconfirmed ideas.
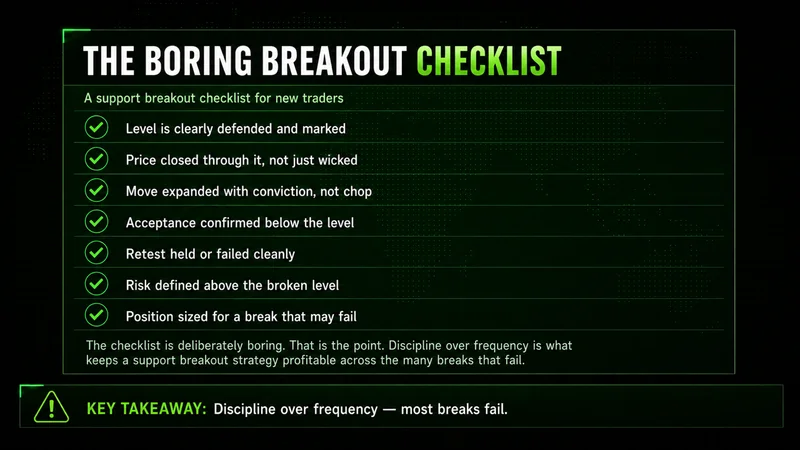
A support breakout checklist for new traders
This support breakout checklist for new traders is meant to be run before every entry, not memorized once. If any item fails, the trade does not happen.
Is the support level marked from at least two prior reactions, drawn as a zone?
Does a support break align with the broader trend and structure?
Has price closed beyond the level on my execution timeframe, not just wicked through?
Is there real participation behind the move, or is flow thin and hesitant?
Has the level held as resistance on a retest, or am I entering on the failed reclaim?
Is my invalidation defined above the reclaimed level before I enter?
Is my position sized from the stop distance, not from how confident I feel?
The checklist is deliberately boring. That is the point. Discipline over frequency is what keeps a support breakout strategy profitable across the many breaks that fail.
FAQs
What is a support breakout in trading? It is when price closes through a support level that buyers had been defending, turning that level from a floor into a ceiling. It signals that the participants who used to buy there are no longer in control, and it only counts once the market accepts the new level rather than immediately reclaiming it.
How do I confirm a support breakout before entering a trade? Look for a candle close beyond the level on your execution timeframe, visible participation behind the move, and a retest where the broken support holds as resistance. The more of these conditions align, the higher the probability the level is genuinely lost. A break that closes back inside the level is a rejection, not a breakout.
What is the difference between a support breakout and a resistance breakout? A support breakout moves into territory where buyers are stepping aside and trapped longs are forced out, so it can accelerate sharply on capitulation. A resistance breakout is driven by fresh demand and often grinds higher. After a support break, the broken level becomes overhead resistance; after a resistance break, it becomes underlying support.
What is the best timeframe for support breakout analysis? The one that matches your holding period, with the level itself read on a higher timeframe than you execute on. Higher timeframes produce fewer but more meaningful breaks, while lower timeframes generate more noise. Treat breaks during thin, low-liquidity hours with suspicion regardless of timeframe.
A support breakout is a behavioral event the chart records after the fact. Mark the level cleanly, wait for acceptance, read the retest, and define invalidation before you enter. Do that consistently and the fakeouts become small, survivable costs instead of the trades that decide your month.
Worth the read?


