
Support, Resistance, and Trendlines Explained
Learn how support, resistance, and trendlines work in trading, including how to identify key zones, spot breakouts, and use retests with confidence.
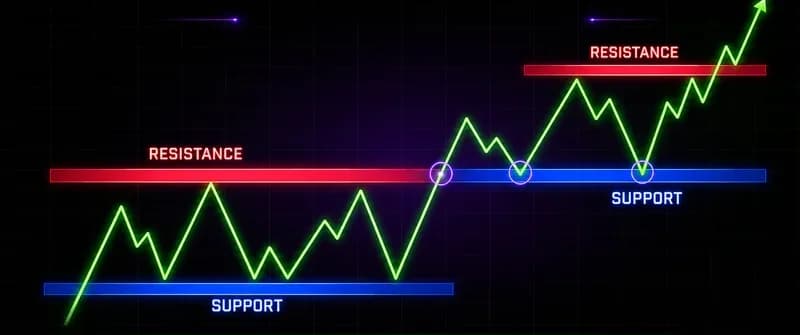
Support, resistance, and trendlines are three ways of describing the same thing: where price has paused, reversed, or accelerated in the past, and where participants are likely to react again. Support is a price area where buyers have repeatedly stepped in. Resistance is a price area where sellers have repeatedly stepped in. A trendline connects those reactions across time, so the bias becomes visible at a glance. None of them predicts. They describe context, and context decides whether a setup is worth taking.
Most beginners draw these tools precisely and trade them mechanically. That is where the trouble starts. Markets reward traders who treat support and resistance as zones, not lines, and who use trendlines to confirm what structure is already showing.
What support and resistance actually are
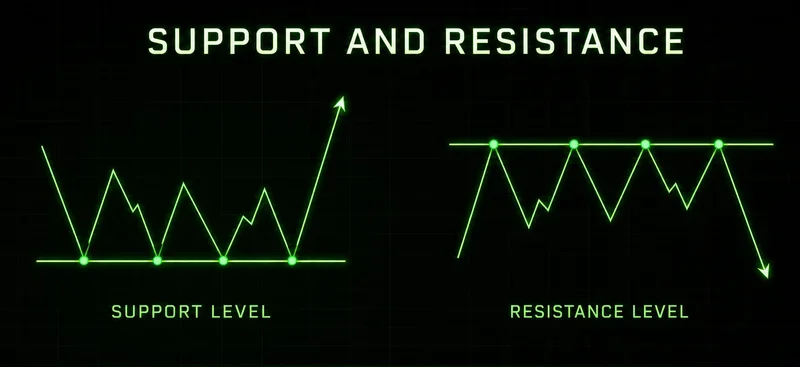
Support is the price area where demand has historically outweighed supply enough to stop a decline. Resistance is the inverse — the area where supply has outweighed demand enough to stop a rally. These are not magical levels. They are footprints left by participants who acted at those prices and are likely to act again when the price returns.
A single touch is not a level. A reaction in the same area on two or more separate occasions starts to qualify. The more recent and repeated the reactions, the more weight the zone carries in current decision-making.
What drives these levels
Support and resistance exist because of order flow, not because of geometry. Three forces build them:
Resting liquidity — limit orders sitting at prior highs and lows.
Trapped traders — positions taken at obvious extremes that need to be unwound.
Decision points — areas where institutions previously initiated or defended size.
When price approaches a level, the real question is not "will it hold?" — that is unknowable in advance. It is "how does it behave on the test?" Acceptance above resistance, or rejection from support, is what gives the level meaning in real time. Without one or the other, a touch is just a touch.
How to draw support and resistance correctly
The goal is not to draw the cleanest chart. It is to mark areas that have produced repeatable reactions. A workable process:
Zoom out first. Find the highest-timeframe swing highs and lows that the current price still respects.
Mark the area, not the wick tip. The wick is one extreme of one print; the area around it is where real orders sat.
Keep the chart sparse. Three to five levels per timeframe is enough.
Refresh as price evolves. Old, untouched levels lose relevance; new reaction zones replace them.
Levels versus zones — the distinction beginners miss
A level is a single price. A zone is a range. Treating support and resistance as exact lines is the most common reason early traders get stopped out before the level actually works.
Price rarely reverses at one exact tick. It probes, sweeps liquidity, then accepts or rejects. A reasonable zone is the area between the body close and the wick extreme of the candles that defines the prior reaction. Drawing a one-tick line and placing a stop one tick beyond it is how traders donate to the people, fading the obvious extreme.
What is a trendline in trading
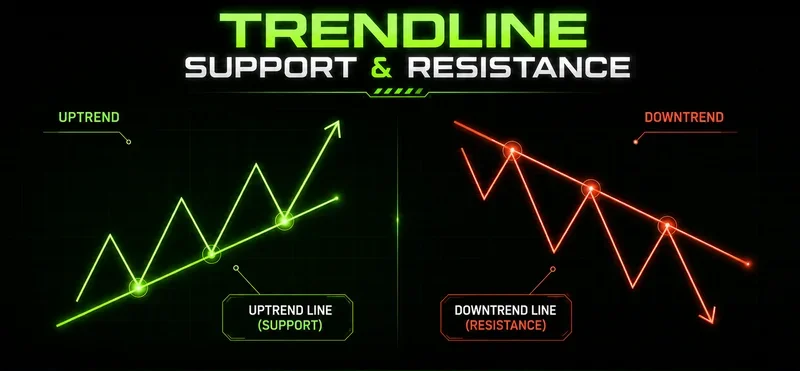
A trendline is a diagonal line drawn across consecutive swing points to describe the slope of a move. There are two basic variants:
Ascending trendline — connects rising swing lows in an uptrend. As long as the price keeps making higher lows along that line, the structure is intact.
Descending trendline — connects falling swing highs in a downtrend. As long as the price keeps making lower highs along that line, the structure is intact.
A valid trendline needs at least three touches. Two points define any line; three is the first time the slope is confirmed by behaviour. A break of a long-respected trendline is information, not a signal to take an opposing trade.
How to draw trendlines correctly
Trendlines describe momentum. The slope itself carries information — a shallow line implies measured accumulation or distribution; a near-vertical line implies climactic, unsustainable behaviour.
A few rules that hold up in live conditions:
Use swing points, not arbitrary lows. Connect the visually clear pivots.
Prefer body closes over wicks when the wicks distort the slope.
Redraw when the trend accelerates or decelerates.
A trendline that needs constant adjustment is not a trendline. It is a line you want to be true.
Trading the bounce versus trading the break
There are two primary ways to use these tools. Both are valid; both have failure modes.
The bounce trade enters near a level in the direction of the existing structure — long near support in an uptrend, short near resistance in a downtrend. Entry comes after a clear rejection (a wick, a reversal candle, displacement away from the zone), not on arrival at the level. Risk is defined just beyond the zone — past the wick, not at the close.
The break trade enters after the price has accepted through a level — closed beyond it on the relevant timeframe and held that acceptance on the retest. Most failed breakouts are taken on the initial print, not on confirmation. Most break trades fail because the entry was emotional instead of structural. Waiting for the retest costs a little upside in clean moves and saves the account in messy ones. Breakouts and false breakouts deserve their own study — the failure rate is high enough that any trader using these tools needs a separate framework for telling the two apart.
When support, resistance, and trendlines stop working
Levels work in normal conditions. They break down into three specific regimes, and recognising the regime matters more than redrawing the line.
During high-impact macro releases — FOMC, NFP, CPI — structural lines are routinely ignored. Volatility expansion runs through prior levels, sweeps liquidity on both sides, and only after the dust settles does structure begin to mean something again. The first move out of those releases is usually not the cleanest opportunity.
During regime transitions — a trending market shifting into a sustained range, or the reverse — old trendlines and levels lose relevance before new ones are obvious. The chart still prints higher highs while the order flow underneath has already shifted. This is where mechanical trendline trading produces the largest drawdowns.
And during overnight, thin-liquidity sessions, the same support and resistance that read cleanly in cash hours mean almost nothing. The participants who defended those levels are not at their desks. Wicks through prior zones are common and tell you nothing about the next session.
The takeaway is not to abandon the tools. It is to know when context invalidates them and to step back rather than force the same playbook into a different regime.
Common mistakes traders make with these tools
A few patterns repeat across new traders' charts:
Drawing too many levels until every move "respects" something. A chart with twenty lines holds no information.
Treating lines as exact prices instead of zones, then placing stops one tick beyond the wick.
Forcing a trendline through irrelevant points to make a bias look valid.
Entering the bounce on touch instead of waiting for rejection.
Entering the break on the first print through, not on the retest hold.
Ignoring the higher timeframe. A pristine 5-minute level inside a clean 1-hour downtrend is not a bounce setup.
Most of these are discipline issues, not analysis issues. The lines were drawn correctly. The execution gave the edge back.
FAQs
What is support in trading? Support is a price area where buyers have repeatedly stepped in and stopped a decline. It is not a single price but a zone where demand has historically outweighed supply, marked by two or more prior reactions on the chart.
What is resistance in trading? Resistance is the inverse of support — a price area where sellers have repeatedly stopped a rally. It works the same way: a zone, not a line, defined by prior reactions and confirmed when the price reaches it again and rejects.
How do you draw support and resistance correctly? Zoom out to a higher timeframe, mark the swing highs and lows that the current price still respects, draw the area between the wick and the body close rather than a single tick, and keep the total to three to five levels per timeframe. Refresh as price evolves.
What is a trendline in trading? A trendline is a diagonal line connecting consecutive swing points — rising lows for an ascending trendline in an uptrend, falling highs for a descending trendline in a downtrend. It needs at least three touches to be considered valid, and its slope describes the momentum of the move.
Worth the read?


