
Support and Resistance Trading Strategy — Read the Reaction
A support and resistance trading strategy works only when you trade the reaction at the level, not the line you draw. Here is how to read and trade it.
A support and resistance trading strategy is a method for trading the price levels where a market has repeatedly stopped and reversed: support is where falling price tends to find buyers, resistance is where rising price tends to find sellers. The strategy is not the line you draw. It is the reaction price shows when it reaches that line. Most traders lose at these levels because they treat a drawn price as a signal, then enter the moment price touches it. The level only marks where to pay attention. The reaction tells you whether there is a trade.
That distinction decides almost everything that follows. A level that price slices through without hesitation was never support. A level that price rejects with a long wick and a fast turn was. You cannot know which one you have until price gets there and behaves. So the entire method is built around patience at the level, not prediction of the level.
What is a support and resistance trading strategy?
A support and resistance trading strategy uses horizontal price levels as decision points. You mark where price has reversed before, you wait for price to return, and you trade the way it reacts when it does. Support sits under price and represents an area where buying interest has previously absorbed selling. Resistance sits above price and represents an area where selling interest has previously capped buying.
These levels exist because of positioning, not magic. When price reaches a region where a lot of participants made decisions before, the orders left behind there influence what happens next. Buyers who missed an earlier move place bids. Traders who are trapped at a level look to exit near breakeven when price returns. That clustered behavior is what makes the same prices matter more than once. The level is a record of where decisions happened, and the reaction is the market deciding whether those decisions still hold.
The strategy fits a specific job. It works best when you want defined risk and a clear point that proves you wrong. If a level breaks and holds against you, the idea is invalidated and you are out. That is the appeal: support and resistance gives you a place to be wrong cheaply, which matters more than being right often.
Why price stalls at the same levels
Price stalls at familiar levels because memory drives order flow. Markets are not a smooth average of opinions. They are a record of where size traded, where participants got positioned, and where they are still waiting to act.
Three forces concentrate orders at a level:
- Buyers who watched price leave a zone want a second chance, so they place bids back at it.
- Sellers who were trapped when price dropped want out near their entry, so they add supply on the way back up.
- Traders watching the same chart see the same obvious level, so their stops and entries cluster in the same band.
None of this requires a theory about value. It is positioning leaving a footprint.
This is also why a level weakens each time it is tested. The first touch meets the most resting orders. By the third or fourth touch, much of that interest has been filled or pulled, and what remains is thinner. A level that looks strong on the chart can be nearly empty underneath if price has already worked it several times. Reading support and resistance well means tracking not just where the level is, but how much is likely left to defend it.
How to draw support and resistance correctly
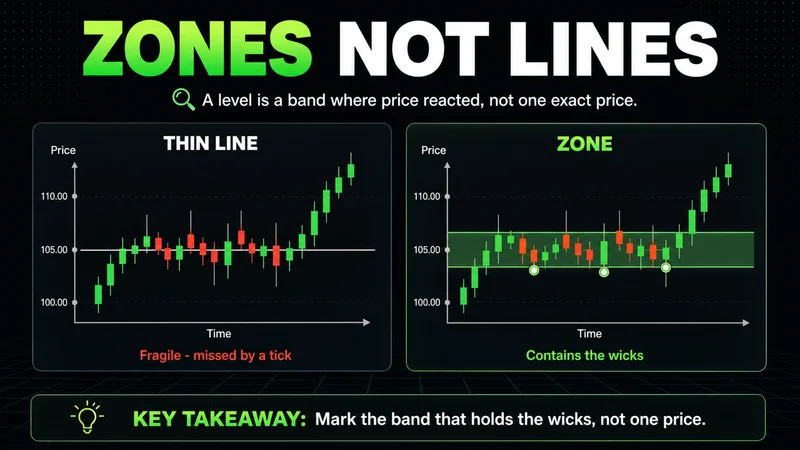
The most common drawing mistake is precision. Traders mark one exact price and treat a single-tick miss as proof the level failed. Real levels are zones, not lines. Price reverses inside a band where wicks, bodies, and closes cluster, and that band is what you trade.
To draw a level that means something, work through a short checklist:
- Mark the band that contains the cluster of reactions, using the wicks and closes that turned price, not one arbitrary price.
- Favor levels visible on a higher timeframe. A zone that shows up on the daily or four-hour chart holds more weight than one only visible on the one-minute.
- Require more than one touch. A single reaction is a line on a chart. Two or three clear reactions make it a level.
- Keep the chart clean. A handful of levels you respect beats twenty you ignore.
The difference between a thin line and a proper zone is not cosmetic. A line invites you to enter at one price and get stopped by a one-tick overshoot. A zone gives the reaction room to develop and gives your invalidation a logical place to sit, just beyond the band where the idea is genuinely wrong.
How to grade a level before you trade it
Not every level deserves a trade. This is the step most explanations skip, and it is where the edge actually lives. Drawing a level tells you where price might react. Grading it tells you whether the reaction is worth your risk.
Grade a level on four things, and weight them together rather than in isolation:
| Factor | Stronger level | Weaker level |
|---|---|---|
| Touches | Two to three clean reactions | One touch, or so many the level is exhausted |
| Reaction force | Sharp rejection, fast move away | Slow drift, shallow bounce |
| Confluence | Lines up with a higher-timeframe zone or prior range edge | Stands alone with nothing behind it |
| Freshness | Recently respected, orders likely still resting | Tested many times, interest mostly filled |
A level with two sharp reactions, confluence from a higher timeframe, and only a couple of tests is a high-probability environment. A level touched once on a quiet afternoon, or one hammered so many times it is hollow, is a low-quality condition you can pass on. The damage to most accounts here is not analysis. It is selection. Traders take every level instead of waiting for the few worth trading, and the account bleeds from a hundred marginal entries that each looked fine in isolation.
Three ways to trade support and resistance
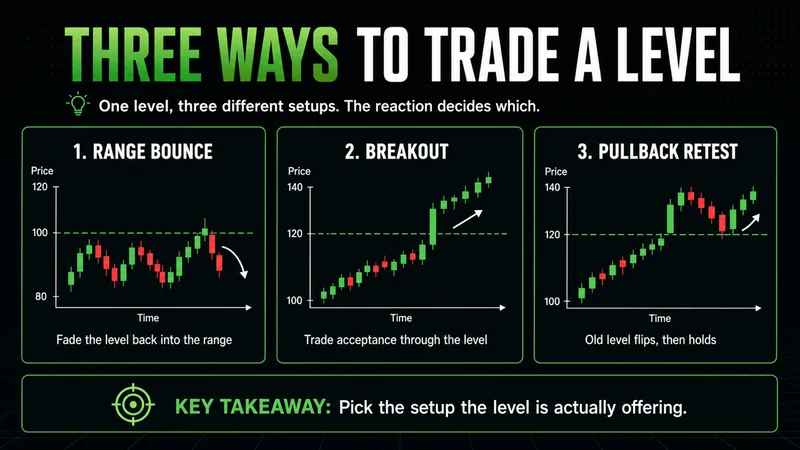
Once you have a graded level, there are three core ways to trade it. They are not interchangeable. The market offers one of them at a time, and your job is to take the setup that is actually on the table rather than force a favorite:
- Range bounce — fade the level back into the range. Price approaches support from inside a range, shows rejection, and you trade the turn back toward the other side. This is the textbook play, and it works while the range holds.
- Breakout — trade acceptance through the level. Price closes through resistance on an expansion candle and continues, signaling that the prior balance has broken. The key word is acceptance: not a single poke through, but price closing and holding beyond the level.
- Pullback retest — wait for the broken level to flip. After a breakout, price often returns to the level it just broke, and a broken resistance can become support. You let price re-test that flipped level and enter when it holds.
Most breakouts fail because traders enter emotionally instead of structurally. The breakout candle looks exciting, they chase it, and price snaps back through the level and stops them out. The pullback retest exists precisely to filter that. Letting the level prove itself as new support or resistance costs you some entries that run without you, but it removes most of the false breaks that drain a breakout strategy.
How to confirm and enter the trade
Confirmation is the entire game. The level is not the trade; the reaction at the level is. You mark the zone, you watch how price behaves as it approaches, and you act only after the reaction shows itself.
A clean sequence at support looks like this. Price falls into the zone. It prints a rejection: a long lower wick, a failure to close lower, a clear refusal to accept prices below the band. Then it turns. You enter on that confirmation, not on the first touch, and your invalidation sits just past the far side of the zone, where a hold against you would prove the level gone.
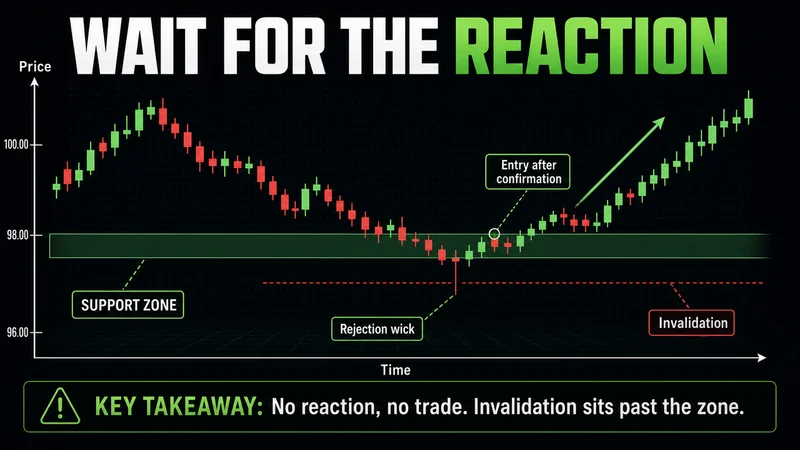
Waiting for confirmation is part of the job, not a delay in it. The entries you skip because the reaction never came are the entries that would have hurt. An average entry with the stop in a sensible place tends to survive; a clean-looking entry taken early, with the stop where a single wick can reach it, tends not to. Confirmation trades structure. The touch alone trades hope.
When support and resistance stops working
Support and resistance has clear conditions where it stops working, and no method survives every regime intact. Knowing where this one breaks down is what separates using the tool from trusting it blindly.
The framework reads cleanly in balanced, liquid conditions: a market that is rotating, with real two-sided participation and orders resting at obvious levels. Take those same levels into a strong trend and they behave differently. In trending displacement, price runs through support and resistance with barely a pause, because one side has stepped away entirely and there is nothing at the level to defend it. Fading a level in that environment is how traders end up repeatedly stopped, fighting a move that has no interest in stopping.
Two other conditions degrade these levels fast. Thin overnight liquidity makes a clean level meaningless, because the resting orders that gave it weight in the regular session are simply not there. And the first move after major news is rarely the cleanest opportunity. Volatility expands, levels get swept and reclaimed in seconds, and a band that held for days can mean almost nothing in the minutes after a release. The level did not change. The participation around it did, and that is what the level was measuring all along. When the conditions that make a level matter are absent, the smart move is to wait rather than to keep trading a tool that has quietly stopped working.
FAQs
What is a support and resistance trading strategy in simple terms? It is trading the price levels where a market has repeatedly reversed. You mark support below price and resistance above it, wait for price to return, and trade the reaction, going long when support holds or short when resistance rejects, with your risk defined just past the level.
How do I draw support and resistance levels correctly? Mark zones, not single lines. Draw the band that contains the cluster of wicks and closes where price turned, favor levels visible on higher timeframes, and require at least two clear reactions before you treat a price as a real level.
What is the difference between support and resistance zones and lines? A line is one exact price; a zone is the band around it where reactions actually happen. Zones are more reliable because price rarely reverses at the same tick twice, and a zone gives your entry room to develop and your invalidation a logical place to sit.
How do I confirm a support and resistance trade before entering? Wait for the reaction. Look for a rejection wick, a failure to accept beyond the level, or a clear shift back in the other direction, then enter after that confirmation rather than on the first touch. Keep invalidation on the far side of the zone so a genuine break takes you out cleanly.
Keep learning
Support and resistance is the foundation other tools build on. To go deeper, work through these next:
- How to grade level strength before you risk capital on it
- Breakout versus pullback entries, and when each one fits
- Reading liquidity and order flow around key levels
- Building defined-risk invalidation into every level you trade
Worth the read?


