
Volume Trading Strategy for Beginners — Read the Tape
A volume trading strategy for beginners works when volume confirms participation instead of predicting price. Read the tape, mark the level, define risk.

A volume trading strategy for beginners works best when you stop asking volume to predict and start letting it confirm. Volume measures participation: how many shares or contracts actually changed hands behind a move. It does not tell you where price goes next. It tells you whether the move that already happened had real buyers and sellers behind it, or whether it drifted through an empty level on almost nothing. Most beginners use this backward. They see a volume spike and treat it as a signal to enter, when the spike is evidence about a move that is already underway.
That distinction sounds small. In live trading it decides whether you are reading the market or guessing at it. Price can move on heavy participation or on almost none, and the two look identical on a bare candlestick chart. Volume is the layer underneath that tells you which one you are looking at.
A workable beginner approach rests on three pillars, and the rest of this guide builds each one out:
- Structure — a level marked in advance, so you are reacting to price instead of chasing it.
- Confirmation — volume that expands in the direction of the move, so you trust real participation over a hollow push.
- Risk — a defined point where you are wrong, sized before you enter, so a bad read costs a small, planned amount.
What volume actually tells you
Volume is the count of executed trades over a period. On a daily chart, one volume bar is a full session of buying and selling. On a five-minute chart, it is five minutes of the same. Higher volume means more participants agreed the price mattered enough to transact right there. Lower volume means fewer did.
That is the entire foundation of trading volume analysis, and it is simpler than most explanations make it. You are not measuring direction. You are measuring conviction. A green candle on heavy volume and a green candle on thin volume are not the same event, even when they close at the same price. The first had participation. The second had drift.
Three things volume can tell you, and one it cannot:
- Conviction. Heavy participation says many traders agreed the price mattered. Thin participation says few did.
- Effort versus result. A big move on small volume took little effort to produce, which means little stood in its way and little supports it now.
- Where the activity clusters. The levels that print the most volume are the levels the most participants cared about, which is why they tend to act as support and resistance later.
- Not direction. Volume never tells you which way price goes next. A spike can precede a continuation or a reversal. It describes the move that already happened.
So what is a volume trading strategy in practice? It is a set of rules for reading that participation alongside price, then acting only when the two agree. Volume is context, not a trigger on its own. It earns its place on the chart by telling you whether to trust what price is doing — nothing more, and nothing less.
This is also why volume belongs near the start of a beginner's process rather than buried under a stack of indicators. It asks one honest question: did anyone of size actually show up for this move? Answer that consistently and most of the noise on a chart starts to organize itself.
How to read trading volume on a chart
Volume sits in a small panel under price, drawn as vertical bars. Each bar lines up with the candle above it. The skill is not reading any single bar — it is reading bars relative to their recent neighbors. One tall bar means nothing in isolation. A tall bar next to twenty short ones means something.
The reference point that matters is the average. Compare the current bar to the recent average for that same instrument and timeframe. Some platforms draw a moving average directly across the volume panel, which makes this easier. The questions worth asking stay the same:
- Is volume expanding or contracting as price moves?
- Did the bar that pushed through a key level come on above-average participation?
- Is a strong-looking candle backed by volume, or is it hollow?
This is where volume price action becomes useful instead of decorative. Rising price on rising volume shows participation following the move. Rising price on falling volume shows a move running out of fuel. Neither is a guarantee. Both are information you did not have from price alone.
A practical note on context. The same volume reading means different things at different times of day. The opening and closing auctions print enormous volume by design, and the overnight session prints very little. Comparing a mid-session bar to the open is comparing two different environments. Read volume against its own time of day, not against the whole session.
How volume confirms a breakout
A breakout is only worth trusting when participation expands with it. When price clears a resistance level on volume well above its recent average, real buyers are stepping in to take the level. When price clears that same level on below-average volume, it is drifting through an empty zone, and those breakouts tend to fail and reverse back inside the range.
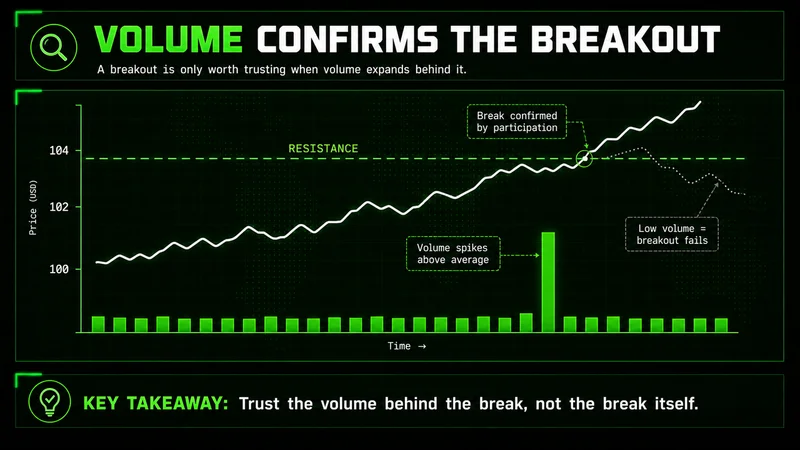
This is the cleanest application of volume confirmation for a beginner. You are not predicting the breakout. You are waiting for price to attempt it, then reading the volume into the attempt. Breakout volume that expands in the direction of the move is the confirmation. The break itself is not.
The failure mode is chasing. A beginner sees price clear a level, feels the urgency, and enters on the candle. Half the time the volume behind that candle is thin, the level was never truly accepted, and price slides back through within a few bars. The fix is patience: let the level break, read the participation, and act on the confirmation rather than the excitement.
Most breakouts fail because traders enter emotionally instead of structurally. The level breaking is the invitation. The volume behind it is the answer.
When you are reading breakout volume in the moment, three checks separate a real break from a hollow one:
- Did volume expand on the breakout bar? The bar that clears the level should print above its recent average, not below it.
- Did price hold after the break? Acceptance means price stays on the far side of the level rather than snapping straight back.
- Is the expansion in the direction of the break? Heavy volume that stalls price instead of carrying it is a warning, not a confirmation.
High volume on the break, followed by price holding above the old level, is what acceptance looks like. Thin volume on the break, followed by a quick reclaim, is what a fakeout looks like. You will not catch every one. You will catch enough of the obvious ones to make the read worth running.
High volume versus low volume — what each one means
High volume and low volume are not good or bad on their own. They describe the environment you are trading in, and that environment changes how much weight any move deserves.
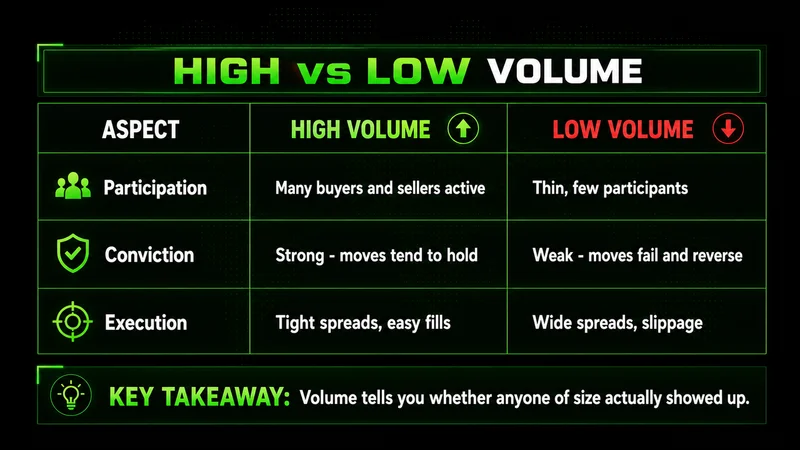
High volume trading means many participants are active at once. Conviction is stronger, moves tend to hold, and fills come easily because there is size on both sides of the book. When a level gives way on heavy volume, the market is telling you a lot of people agreed it should.
Low volume trading is the opposite. Participation is thin, spreads widen, and moves fail more often because there is not enough size behind them to sustain anything. A level that breaks on low volume can reverse without warning, because the break never had real agreement behind it. Thin conditions also produce sharper, more erratic candles — fewer participants means each order moves price further.
The contrast is easier to hold side by side:
| Aspect | High volume | Low volume |
|---|---|---|
| Participation | Many buyers and sellers active | Thin, few participants |
| Conviction | Strong, moves tend to hold | Weak, moves fail and reverse |
| Execution | Tight spreads, easy fills | Wide spreads, more slippage |
| Breaks | More likely to be accepted | More likely to be a fakeout |
A few habits follow directly from that table:
- Give breaks on high volume more trust than breaks on low volume.
- Expect thin conditions to produce erratic, oversized candles, and size smaller for them.
- Treat a quiet, low-volume session as a reason to do less, not a reason to force a trade.
The beginner's mistake is reading every green candle as bullish and every red candle as bearish. The volume underneath tells you whether the candle reflects real conviction or just a handful of orders pushing an empty market around. Same candle, different meaning, depending on who actually showed up.
A simple volume strategy you can actually follow
You do not need five indicators to use volume. You need a level, a read, and a defined risk. Here is a beginner-grade sequence that keeps the chart clean and the decision honest.
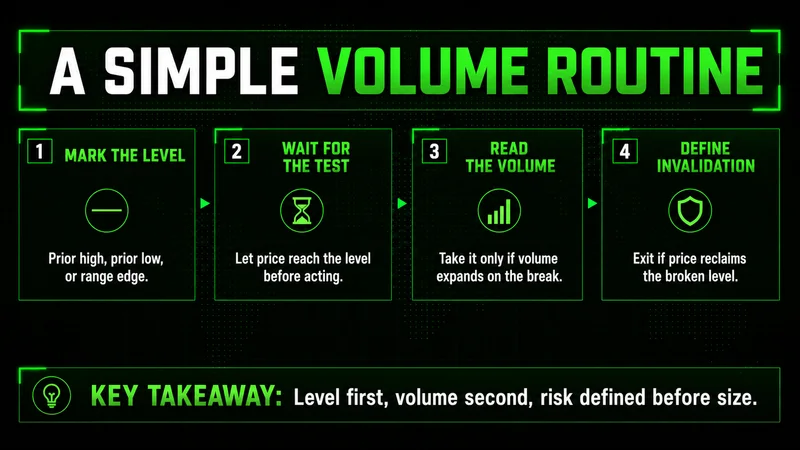
- Mark the level that matters. A prior high, a prior low, or the edge of a range. One clear line, not ten.
- Wait for price to reach it. Do not anticipate. Let price come to the level and put it to the test.
- Read the volume into the test. Take the move only when volume expands in the direction of the break. Flat or falling volume is your cue to stand aside.
- Define invalidation before you size. Decide where you are wrong — usually a reclaim of the broken level — and size the position so that being wrong costs a small, planned amount.
That is a complete simple volume trading strategy with examples you can find on any chart, on any timeframe. The level gives you structure. The volume gives you confirmation. The invalidation gives you survival. Run it the same way every time and the results start to come from process rather than mood.
Notice what is missing: a prediction. Nowhere does the sequence ask you to guess direction in advance. It asks you to react to what price and volume do at a level you marked ahead of time. That is the difference between trading and forecasting.
When volume lies — the conditions that break confirmation
Volume confirmation is not a universal law, and pretending it is will cost you. There are conditions where the same volume read that works cleanly in liquid daytime markets means almost nothing. Three break it most often:
- Thin, illiquid instruments, where one order distorts the whole picture.
- Auction and overnight prints, where volume reflects structure rather than conviction.
- Absorption at a level, where heavy volume defends price instead of driving it.
Thin, illiquid names are the first. In a stock that trades a few thousand shares a day, a single large order can print a volume spike that looks like conviction but is really one participant. The spike is real; the agreement it implies is not. The same applies to overnight sessions in futures, where a thin book produces volume that does not represent the broad participation a daytime bar would.
The auction prints are the second. The open and the close concentrate enormous volume into a few moments by structural design, not because a directional move was confirmed. Reading those prints as breakout confirmation is reading the mechanics of the session, not the conviction of the participants.
Absorption is the third and the subtlest. Sometimes heavy volume at a level is not buyers breaking through — it is a large seller absorbing every bid while price barely moves. High volume with no progress is a warning, not a green light. Price stalling on heavy volume often means the move is being defended, not confirmed. A beginner sees the big bar and assumes momentum; the tape is actually showing a fight that the breakout side may be losing.
The honest version of this strategy names those conditions out loud. Volume confirms participation in liquid, active markets during normal hours. In thin names, in the overnight, into the auctions, or when size is absorbing rather than initiating, the read inverts or goes quiet. Knowing when the tool stops working is part of using it.
Common volume trading mistakes beginners make
Most of the damage comes from a short list of repeatable errors. Naming them is usually enough to start avoiding them.
- Treating a spike as a signal. A volume spike is evidence about a move in progress, not a standalone reason to enter. Context decides what it means.
- Ignoring the average. A bar only reads as high or low relative to recent participation. Without a reference point, every bar looks the same.
- Chasing the breakout candle. Entering on the break instead of waiting for the volume read is how thin fakeouts trap newer traders.
- Reading auction and overnight volume like daytime volume. Different environments, different meaning. Compare like to like.
- Stacking indicators on top of volume. Adding three more tools to confirm what volume already showed adds noise, not clarity.
There is a broader point underneath the list. An indicator informs a decision; it does not make one for you. Volume is one of the better tools a beginner can learn, precisely because it measures something real rather than smoothing price into another curve. But it still only matters when it is read in context, against structure, with risk defined. Used that way, it sharpens decisions. Used as a magic signal, it just becomes one more thing to misread.
FAQs
What is a volume trading strategy in simple terms? It is a set of rules for reading market participation alongside price, then acting only when the two agree. Volume measures how many trades happened behind a move; the strategy uses that to confirm whether the move had real conviction rather than to predict the next one.
How do you use volume in trading as a beginner? Compare the current volume bar to the recent average for that instrument and timeframe. Look for volume expanding in the direction of a move at a level you marked in advance, and treat flat or falling volume as a reason to stand aside.
How does volume confirm a breakout? A breakout backed by above-average volume shows real buyers taking the level, which makes it more likely to hold. A breakout on below-average volume is usually drift through an empty zone and tends to reverse back inside the range.
What is the difference between high volume and low volume? High volume means strong participation, easier fills, and moves that tend to hold. Low volume means thin participation, wider spreads, and moves that fail more often. The same candle carries different weight depending on which one is underneath it.
Does volume trading always work? No. Volume confirmation breaks down in thin, illiquid names, during overnight sessions, into the opening and closing auctions, and when heavy volume is absorbing price rather than driving it. It works best in liquid, active markets during normal hours.
The takeaway
A volume trading strategy for beginners comes down to one habit: let volume confirm, never let it predict. Read each bar against its recent average. Mark the level before price gets there. Take the move only when participation expands in your direction, and define where you are wrong before you size. High volume shows conviction; low volume shows the lack of it; and in thin or absorbed conditions, the read goes quiet and you wait. The traders who last are not the ones who found a secret signal. They are the ones who learned to tell a real move from an empty one, then sized their risk like the difference matters — because it does.
Worth the read?


