
Trendlines — How to Draw, Confirm, and Trade Them
Trendlines mark a trend direction and slope by connecting swing points. Learn how to draw, confirm, and trade them with defined risk and clear invalidation.
Trendlines are diagonal lines drawn across a series of swing points to show the direction and slope of a move. In an uptrend you connect the rising lows; in a downtrend you connect the falling highs. That is the whole definition. The disagreement starts the moment a trader treats the line as a prediction instead of a record of behavior the market has already shown.
Most charts you see online are drawn after the fact, when the trendline looks perfect because the outcome is already known. Live, it rarely looks that clean. A trendline is useful only when it describes structure that price has respected more than once, and only while that structure stays intact. The line does not hold price up. Buyers holding above prior lows hold price up, and the line is just where we expect them to show up again.
This guide covers what trendlines mean, how to draw them so the market respects them, which timeframe to use, how they differ from horizontal support and resistance, how to confirm one before risking capital, and where the whole approach breaks down.
What trendlines actually are, and what they are not
The trendlines meaning that matters in practice is narrow. A trendline marks a path that price has followed and reacted to, drawn so you can anticipate where the next reaction might form. It is a reference point, not a forecast.
What a trendline is not: a guarantee, a level price owes a bounce to, or a reason to trade by itself. The line gains weight from context. The same diagonal across an NQ chart means one thing during cash hours, when participation is high, and almost nothing overnight on thin liquidity, when a handful of orders can push price through it without any real shift in positioning.
Treat the trendline as one input. It tells you where structure has held. It does not tell you whether structure will hold again. That distinction is the difference between using a tool and trusting a line.
How to draw a trendline that the market respects
Drawing is mechanical, but most traders rush it. Here is the sequence I use, and it works the same on a 5-minute chart or a daily.
- Find the dominant direction first. If price is making higher highs and higher lows, you are drawing an uptrend line under the lows. If it is making lower highs and lower lows, you draw above the highs.
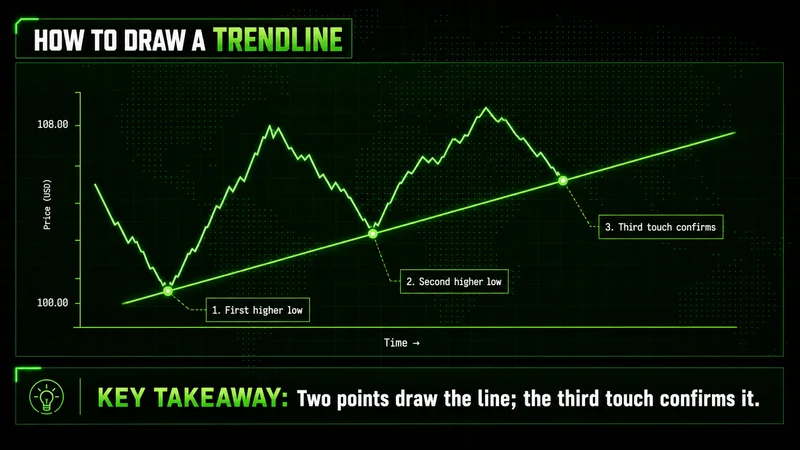
- Connect two clear swing points. Two points define the line. They do not yet confirm it.
- Wait for a third touch and reaction. The third touch is what turns a line you drew into a line the market is using.
- Draw wick to wick first. Wicks mark the true extreme of the reaction. Only switch to body to body if closes keep violating the wick line, which means the wicks were outliers.
- Do not force the fit. If the line only works when you ignore three candles, it is not a valid trendline. Delete it and look again.
A simple trendlines chart example: price bottoms, rallies, pulls back to a higher low, and rallies again. Connect those two higher lows, extend the line, and the next pullback that touches it without breaking gives you a tested reference. The cleaner the touches, the more participants see the same line, and the more reaction you tend to get when price returns to it.
One note on slope. The steeper the line, the less durable it usually is. A near-vertical trendline reflects momentum that cannot sustain, and it tends to break early. A shallower line that price respects over more time carries more weight, because more participants have transacted around it.
The best timeframe for trendlines depends on what you trade
There is no single best timeframe for trendlines analysis. The right one is the one that matches your holding period and the liquidity you trade in.
A swing trader drawing on the daily is reading structure that institutions also see, so those lines tend to produce cleaner reactions. A day trader on the 5-minute is working with faster, noisier structure, where lines form and break within a session. Both are valid. Problems start when a trader draws on a low timeframe and assigns it the significance of a higher one.
The approach that holds up is layered. Establish the trend on the higher timeframe first. Then drop down to refine entries in the direction that the higher timeframe trendline supports. The higher timeframe sets the bias; the lower timeframe sets the execution. When the two disagree, the lower-timeframe line is the weaker one, and it should not override the broader read.
Trendlines vs support and resistance — when to use which
This is where many traders blur two tools that behave differently. Trendlines vs support and resistance is not a rivalry; it is a question of what kind of level you are reading.
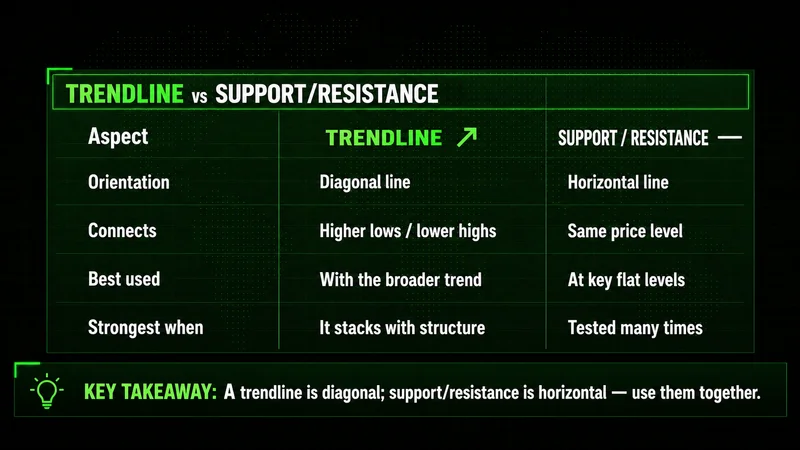
Support and resistance are horizontal. They mark fixed price levels where buyers or sellers have repeatedly stepped in, levels that do not move as time passes. A trendline is diagonal. It marks a level that moves with price, rising or falling along the slope of the trend.
The practical read:
- Use horizontal support and resistance to identify where price has reacted regardless of when. These tend to be the heavier levels, because they sit at a fixed price every participant can see.
- Use a trendline to track the rhythm of an ongoing trend and to anticipate dynamic reactions inside it.
- Give the most attention to the spot where both line up. When a rising trendline meets a horizontal support level in the same zone, you have confluence, and confluence is where reactions tend to be sharpest.
A trendline alone is rarely enough. It becomes a setup worth considering when it stacks with horizontal structure, with the broader trend, and with how price is behaving as it approaches.
How to confirm a trendline before you trade it
Drawing a line is not a signal. Trendlines confirmation is the step that separates a reference from an entry, and it is the step most beginners skip.
To confirm a trendline before entering a trade, wait for price to interact with the line and then show you a reaction you can define. On a bounce, that means price reaches the line and rejects it, ideally with a close back in the direction of the trend rather than just a wick poke. On a break, it means a close through the line with follow-through, not a single candle that pierces and reverses.
The trend is your friend until it bends, and the bend is information, not a betrayal.
Confirmation also means defined invalidation. Before you take the trade, you should already know the price that proves the line wrong. For a bounce, that is a clean close beyond the line. For a break, it is a reclaim of the level with acceptance. If price closes back through and holds, the break was a fakeout, and the prior structure is still in control. Without a predefined invalidation, you are not trading the trendline; you are hoping near it.
Most breakouts fail because traders enter emotionally on the first touch instead of waiting for the close and the reaction. The line gives you a location. The reaction gives you the trade. Chasing the location without the reaction is how good levels turn into bad entries.
A pre-trade trendline checklist new traders can actually run
A trendlines checklist for new traders keeps execution honest when the chart starts moving and judgment gets noisy. Run through it before every trade tied to a line.
- Is the dominant trend clear, and does the line match it?
- Does the line have at least two clean touches, with a third reaction confirming it?
- Is the slope reasonable, not near-vertical?
- Does the line align with horizontal support or resistance, or with a higher-timeframe level?
- Has price shown a defined reaction at the line, a rejection close or a break-and-hold?
- Do I know the exact price that invalidates the idea?
- Is my risk defined and sized so a single loss does not affect my next decision?
If any answer is no, the setup is incomplete. That is not a reason to force it. It is a reason to stand aside. The trades you skip in unclear conditions protect the capital you need for the ones worth taking.
Common trendline mistakes that quietly cost you
The common trendlines mistakes beginners make are rarely dramatic. They accumulate quietly until the account shows the damage.
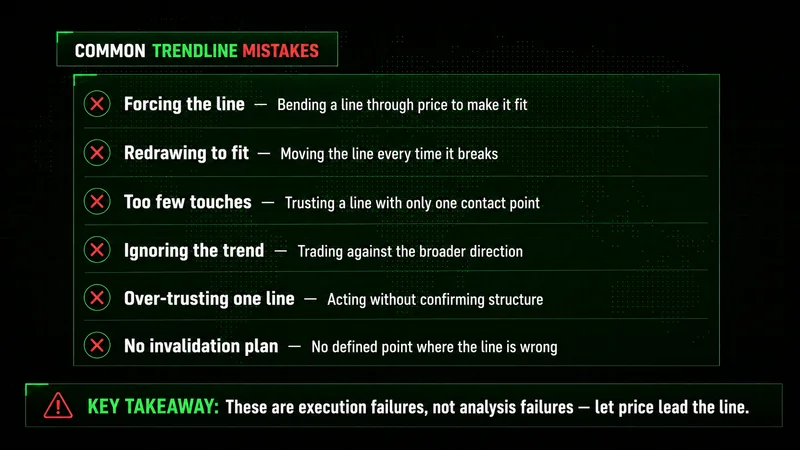
- Forcing the line to fit. Adjusting a trendline until it touches the most candles produces a line that describes nothing.
- Trading the first touch. Two points draw a line; they do not confirm it. The reaction is the signal.
- Ignoring the higher timeframe. A clean line on the 5-minute means little if it fights the daily structure.
- Treating the line as certainty. A trendline is probabilistic context, not a promise of a bounce.
- Skipping invalidation. Without a defined exit, a small loss becomes an emotional one.
- Drawing too many lines. A chart covered in trendlines is a trader searching for confirmation that is not there.
None of these are analysis failures. They are execution failures. The rules above are simple to read and hard to follow once the chart is moving and capital is on the line.
Where a trendline strategy breaks down
A trendlines trading strategy works while the conditions it assumes stay intact. It assumes orderly structure, reasonable participation, and a market that is trending or consolidating in a readable way. Remove those conditions and the framework inverts.
In a choppy, directionless market, trendlines form and break constantly, and every line is a false signal waiting to happen. During high-volatility, macro-driven moves, structure that traded cleanly for hours can invalidate within minutes; gold does this regularly when volatility expands. Overnight on thin liquidity, a line that held all session can be sliced through by size that means nothing about real positioning.
The skill is not drawing better lines. It is recognizing when the environment supports the tool and when it does not. A trendline is reactive context, not a predictive system. When conditions stop being readable, the disciplined response is to stand down, not to keep trading a line the market is no longer respecting.
The short version
Trendlines mark direction and slope by connecting swing points, and they are useful only as long as price keeps respecting them. Draw them with at least two clean touches, wait for the third reaction, and prefer shallower lines over steep ones. Match the timeframe to what you trade, and let the higher timeframe set the bias.
Use horizontal support and resistance for fixed levels and trendlines for dynamic ones, and pay the most attention where the two overlap. Confirm with a defined reaction and a predefined invalidation before risking capital, and run the checklist every time. Most of the edge is not in the line. It is in the discipline to wait for the reaction, define the risk, and step aside when the market stops being readable.
Worth the read?


