
Moving Average Trading Strategy — Read the Reaction
A moving average trading strategy frames entries, but the line itself predicts nothing. What matters is how price reacts when it reaches the average.
A moving average trading strategy uses a smoothed line of past prices to define trend direction and frame entries, but the line itself predicts nothing. What matters is how price reacts when it reaches the average and whether the broader structure agrees. Most traders spend their time arguing over which period to use. The edge sits somewhere else entirely.
A moving average takes a set number of closing prices, averages them, and plots that value as a single point. Add a new point each session and you get a line that filters out the noise of individual candles and shows the underlying direction. That smoothing is the entire purpose. It is also the entire weakness, because the line is built from prices that already printed. It describes where the market has been, not where it is going. Treat it as context, and it earns its place on the chart. Treat it as a signal generator, and it will hand you late entries in every condition that matters.
What a moving average trading strategy actually does
The line does three jobs, and all of them are about context rather than prediction:
- It defines direction. When the average slopes up and price holds above it, buyers are in control of the timeframe you are watching. When it slopes down and price stays below, sellers are. That sounds obvious, but most losing trades come from fighting a direction the line already made clear.
- It acts as a reference level. Price tends to pull back toward a moving average and react there, which gives you a place to watch instead of guessing where a retracement might end.
- It filters trades. A simple rule of only taking longs while price is above a rising average removes a large share of low-quality setups. Not because the average is magic, but because it forces you to trade with the dominant flow instead of against it.
None of these jobs requires a perfect number. They require reading the reaction at the line, not the line itself. A trader who internalizes that the average is a frame for context will outperform one who keeps hunting for the parameter that finally makes the line predictive, because no such parameter exists. The average summarizes the past. Your job is to interpret how the present reacts to it.
Simple moving average versus the EMA
A simple moving average strategy weights every price in the lookback period equally. A 20-period simple moving average adds the last 20 closes and divides by 20. Each close counts the same, whether it printed today or 20 sessions ago.
An EMA trading strategy weights recent prices more heavily. The exponential moving average reacts faster to a change in price because the latest closes carry more influence than the oldest ones. That responsiveness cuts both ways. The EMA turns sooner at a real reversal, which is useful, and it also whips around more during noise, which is not.
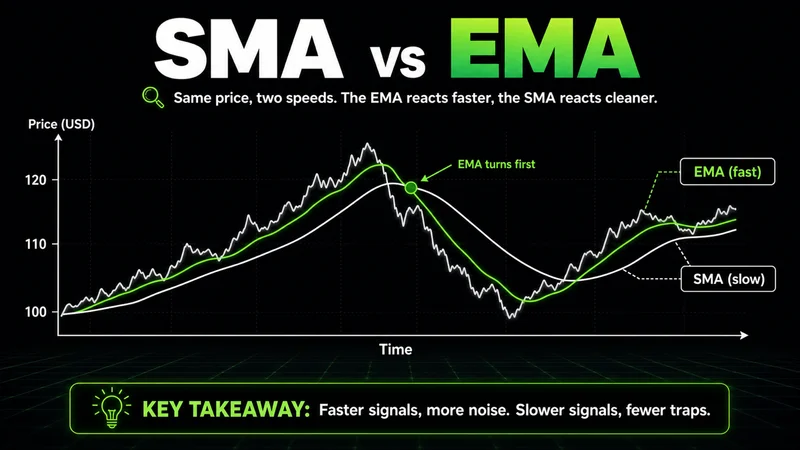
Neither is better in the abstract. The trade-off is simple once you stop looking for a winner:
- The EMA turns sooner at a real reversal and gets you into a trend earlier, at the cost of more false signals during noise.
- The simple moving average turns later and ignores short-term spikes, giving fewer traps and cleaner structure, at the cost of a later entry.
A trader who needs to be in a trend early leans toward the EMA and accepts the extra noise. A trader who wants confirmation and cleaner structure leans toward the simple moving average and accepts the later entry. The choice is a trade-off between speed and reliability, and pretending one side wins outright is how people end up switching settings after every losing trade. Pick the one that fits how you actually trade, then stay with it long enough to learn its behavior.
Reading trend direction from the slope of the line
The most reliable information a moving average gives you is direction, and you read it from the slope. A rising line means the average of recent prices is climbing, so momentum favors the upside. A flat line means the market is balanced and the average has nothing to say. A falling line means sellers have the edge.
This is how moving averages show trend direction without any crossover or extra rule. Price above a rising average is a trend you can participate in. Price chopping across a flat average is a range you should mostly leave alone. The flat phase is where most moving average strategies bleed, because the line keeps issuing signals that lead nowhere.
A trend moving average works best when you let the slope filter your participation. Steep and clean, you press. Flat and tangled, you wait. The patience to sit out the flat sections is worth more than any entry trigger, and it is the part most traders skip.
The moving average crossover, and why most of them fail
A moving average crossover uses two lines of different lengths. A shorter average crosses above a longer one and the rule calls it bullish. The shorter crosses below and the rule calls it bearish. The logic is sound on paper. Recent momentum overtaking the longer trend is a real shift.
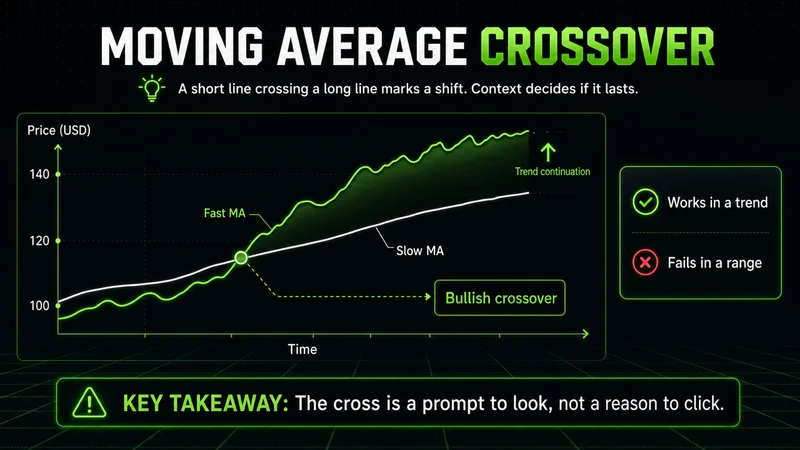
The problem is that a crossover is a lagging event built on top of two already-lagging lines. By the time the cross prints, a chunk of the move is gone. In a clean trend that still leaves room, and the strategy works. In a range, the two lines cross back and forth repeatedly, and each cross is a small loss. Most crossover systems fail not because the logic is wrong but because traders run them in the conditions the logic was never built for.
The fix is context. A crossover that fires in the direction of an established trend, after a flat consolidation, is worth taking. A crossover that fires while price grinds sideways across both lines is noise wearing the costume of a signal. The cross is a prompt to look, not a reason to click.
When the 50 and 200 moving average earn their reputation
Two periods get more attention than any other, and the attention is mostly earned. A 50 moving average strategy tracks the intermediate trend. A 200 moving average strategy tracks the long-term trend. Large participants watch both, which is the real reason they matter. A level works partly because enough capital treats it as a level.
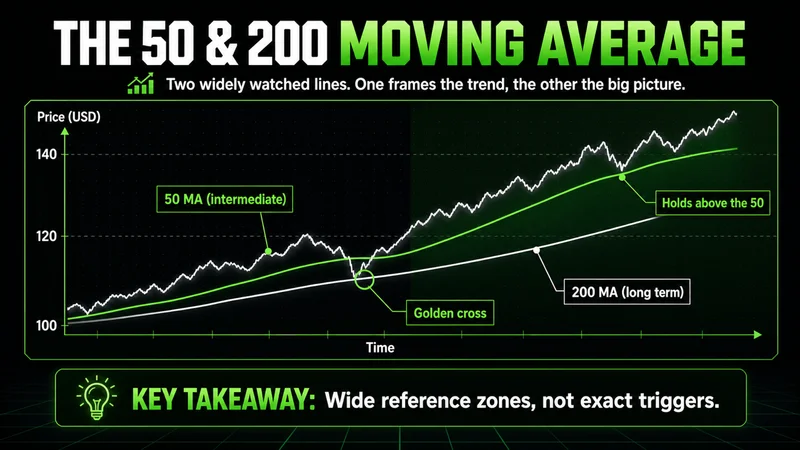
Price reclaiming the 200-period average after a long stretch below it tells you the longer structure is shifting. Price holding above a rising 50-period average during a pullback tells you the intermediate trend is intact. When the 50 crosses above the 200, traders call it a golden cross; when it crosses below, a death cross. The names carry more drama than the events deserve, and both are late by design, but they do mark genuine changes in the longer trend.
What these averages do not give you is precision. They are slow, wide reference zones, not exact lines in the sand. Use them to understand which side of the larger trend you are on, then drop to a faster timeframe for the actual entry. Trading the 200-period average as if it were a tick-level trigger is a common way to get chopped up at a level that was only ever meant to describe the big picture.
Moving averages as support and resistance
Moving average support shows up when price pulls back to a rising average and buyers step in there repeatedly. In a healthy uptrend, price often retraces to a key average, finds demand, and continues. The average becomes a moving floor. In a downtrend, the same dynamic inverts and the average acts as a moving ceiling that caps every bounce.
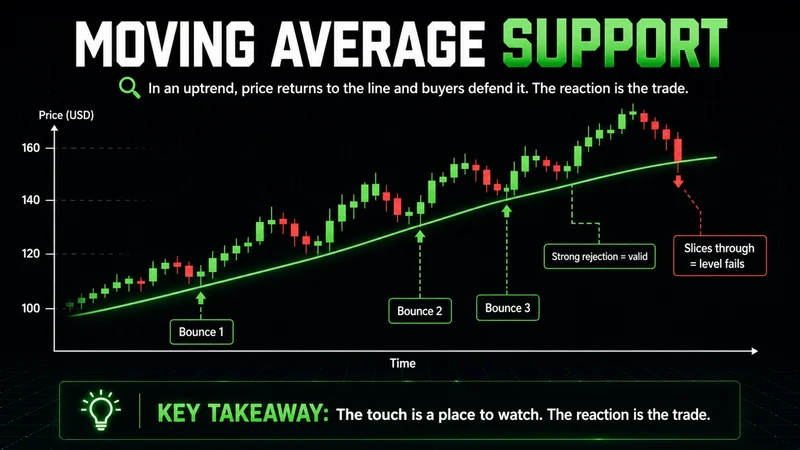
This works for the same reason crossovers work when they work. Enough traders watch the same average that their orders cluster around it, and clustered orders create reactions. A moving average support and resistance strategy is really a way of anticipating where that cluster sits.
The discipline is in the word reaction. A touch of the average is not a trade. What you want is evidence that the level held:
- A strong rejection away from the average in the direction of the trend.
- A shift back in market structure that confirms buyers or sellers defended the level.
- A refusal to accept prices on the other side of the line, shown by quick recovery rather than acceptance.
Price slicing straight through the average without pausing is information too. It tells you the level failed and the trend may be turning, which is a reason to step aside or reassess, not to average down into a losing idea. Buying a moving average simply because price reached it, with no reaction to confirm it, is one of the most common mistakes in this entire approach. The level is a place to watch, and the reaction is the trade.
When a moving average strategy stops working
Every moving average strategy is a trend-following tool, and trend-following tools have one condition where they fall apart. A moving average works cleanly when price trends and respects the line; in a tight range on thin liquidity, the same average becomes a magnet that price crosses again and again, and every signal it gives is a small loss. The tool did not break. It is being used in the regime it was never built for.
The second failure mode is volatility expansion. A moving average can track a market well for hours and then become irrelevant within minutes when a news-driven move rips through every reference level at once. The line lags by construction, and during a violent expansion that lag is the whole problem. Price is three or four full moves past the average before it begins to turn. Anyone trading the line during that window is reacting to information that is already stale.
Indicators are tools, not decision-makers. The market rewards traders who read context, not those who outsource the decision to a line on a chart.
Both failures share a cause. The strategy assumes a trending, orderly market, and it punishes you the moment that assumption breaks. The two regimes where a moving average strategy reliably bleeds are worth memorizing:
- Tight ranges. Price oscillates across a flat average and every crossover or touch becomes a small loss.
- Volatility expansion. A fast, news-driven move outruns the line entirely, so the lagging signal arrives well after the opportunity and the risk.
This is why no single moving average setup works in all conditions. Recognizing which regime you are in matters more than any parameter you choose, and the traders who survive are the ones who stand aside when the line has nothing to say.
Why your settings matter less than your structure
Search for the best moving average settings for beginners and you will find endless debate over 9 versus 20, 50 versus 100, simple versus exponential. The debate is mostly noise. The difference between a 20-period and a 21-period average is trivial compared with whether you are trading with the trend, waiting for a reaction at the line, and sizing the position so a loss is survivable.
A moving average strategy explained for beginners should start with structure, not settings. In order of what actually moves your results, the priorities run:
- Trade direction first. Only take setups aligned with the slope of the average and the broader trend.
- Demand a reaction. Wait for price to react at the line before acting, rather than anticipating a level that has not held yet.
- Size for survival. Define the risk so a single loss is an operational cost, not an emotional event.
- Settings last. Pick one widely watched period and leave it alone long enough to learn its behavior.
Pick one widely watched period, learn how price behaves around it across hundreds of examples, and build the read into your process. The number is a starting point. The skill is the screen time that teaches you what a real reaction looks like versus a fake one.
The most expensive habit in this whole area is switching parameters after every losing trade. It feels like progress and it is the opposite. It destroys the one thing that makes a moving average useful, which is a consistent reference you have learned to read. Among the common moving average trading mistakes, parameter-hopping does more quiet damage than any wrong setting ever could. Keep the line steady. Move your attention to the reaction.
The takeaway
A moving average trading strategy is a context tool, not a crystal ball. The line defines direction through its slope, marks reference levels where price tends to react, and filters out trades that fight the dominant flow. Crossovers, the 50 and 200 periods, and support behavior are all variations on the same idea, and all of them depend on the reaction at the line rather than the line itself. The approach works in a trend and fails in a range, so reading the regime matters more than choosing the period. Get the structure right and the settings nearly take care of themselves.
FAQs
What is a moving average trading strategy? It is a method that uses a smoothed average of past prices to define the trend and frame entries. The average filters out short-term noise so you can see direction more clearly, then you trade in the direction of that trend and watch how price reacts when it returns to the line.
Which is better for a strategy, the SMA or the EMA? Neither wins outright. The EMA reacts faster, so it gives earlier signals and more false ones, while the simple moving average reacts slower, giving later but cleaner signals. Faster trend traders favor the EMA; traders who want confirmation favor the SMA. The right choice depends on whether you value speed or reliability more.
Why does a moving average crossover often fail? A crossover lags because it is built on two already-lagging lines, so part of the move is gone by the time it prints. In a trending market that still leaves room to profit, but in a range the lines cross back and forth and produce a string of small losses. Crossovers work when they fire in the direction of an established trend, not while price chops sideways.
What are the most common moving average trading mistakes? Treating the line as a signal instead of context, trading crossovers in a range, buying a touch of the average with no reaction to confirm it, and switching settings after every losing trade. The last one is the most damaging because it removes the consistent reference you spent time learning to read.
Worth the read?


