
Balance Sheet Analysis — What the Numbers Tell You
Balance sheet analysis reads a company's assets, liabilities, and equity to judge how solvent and durable the business really is.
Balance sheet analysis is the practice of reading a company's assets, liabilities, and equity at a single point in time to judge how solvent, liquid, and financially durable the business really is. It does not tell you what a stock will do tomorrow. It tells you whether the company behind the stock can survive a bad year, and that distinction decides far more outcomes than most investors expect.
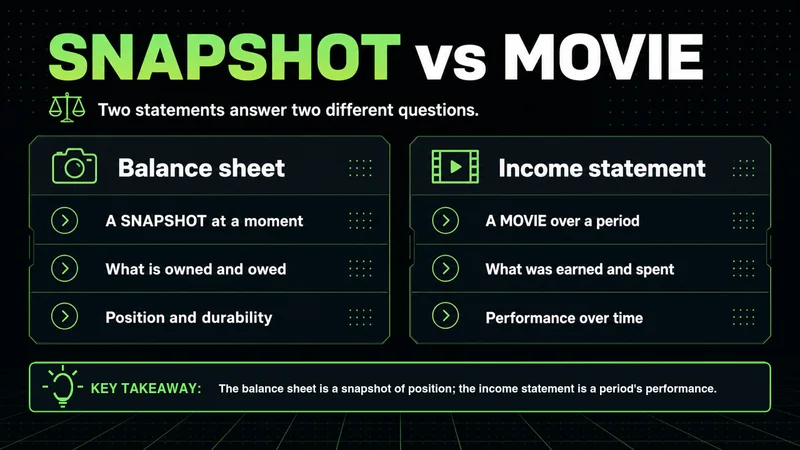
A balance sheet is a snapshot, not a story. The income statement shows what happened over a period; the balance sheet shows what the company is standing on right now. When you analyze it, you are measuring the gap between what is owned and what is owed, and then asking whether that gap is widening or quietly closing.
The three components every balance sheet analysis starts with
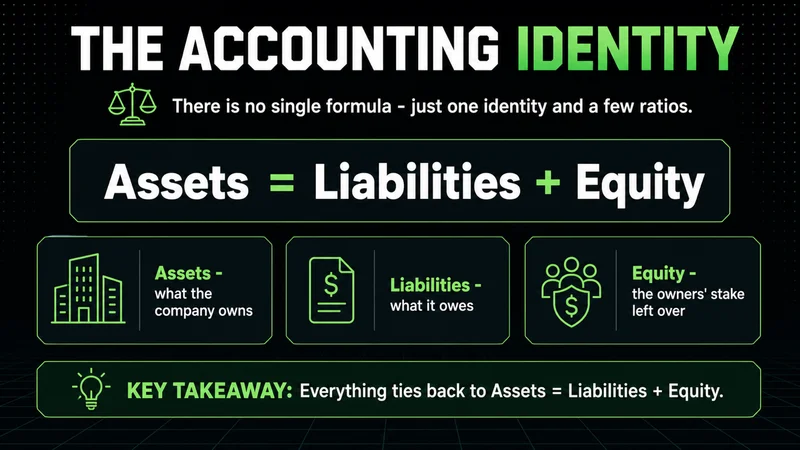
The balance sheet analysis meaning is easier to hold once you see the structure underneath it. Every balance sheet resolves to three parts, and they always tie together through one equation: assets equal liabilities plus equity.
- Assets are what the company owns. They split into current assets, which convert to cash within a year, such as cash itself, receivables, and inventory, and non-current assets, such as property, equipment, and long-term investments.
- Liabilities are what the company owes. Current liabilities come due within a year, including payables and short-term debt; non-current liabilities, such as long-term debt and lease obligations, come due later.
- Equity is what is left for owners after the liabilities are subtracted from the assets. It includes contributed capital and retained earnings, the profits the company has kept rather than paid out.
The components of balance sheet analysis are not interesting in isolation. The relationships between them carry the signal. A company can hold large assets and still be fragile if most of those assets are financed by debt that matures soon. The structure is the point, not the headline total.
The balance sheet analysis formula and the ratios that matter
There is no single balance sheet analysis formula. There is one accounting identity and a small set of ratios that turn raw figures into a readable position. The identity is the anchor:
Assets = Liabilities + Equity. Everything you calculate afterward is just a way of asking how much of the left side the company actually controls.
From there, a handful of ratios do most of the work. The current ratio divides current assets by current liabilities and measures whether short-term obligations are covered. The quick ratio strips out inventory, since inventory is the slowest current asset to turn into cash, and gives a stricter read on liquidity. The debt-to-equity ratio divides total liabilities by equity and shows how heavily the business leans on borrowed money.
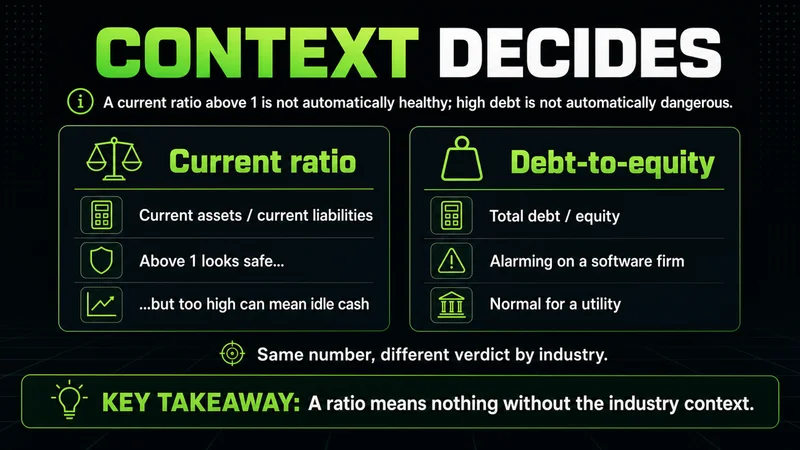
The balance sheet analysis interpretation step is where most beginners stop too early. A current ratio above 1 is not automatically healthy, and a high debt-to-equity figure is not automatically dangerous. Context decides. A utility carries debt that would alarm you on a software company, because its cash flows are steady and predictable. Reading without context is gambling with better vocabulary. The ratio is the question, not the answer.
There is a limit worth naming directly. Ratios derived from the balance sheet read cleanly when the business is stable and the reporting period is normal. During a restructuring, a large acquisition, or a one-time write-down, the same ratios can mislead for a quarter or two until the figures settle. When the underlying business is in motion, treat a single balance sheet as a frame, not a verdict, and wait for a second period to confirm what it shows.
How to read a balance sheet analysis step by step
A consistent sequence keeps the work honest and repeatable. This is the version I use when I want a fast read on whether a company is structurally sound before I look at anything else.
- Confirm the equation balances. Assets should equal liabilities plus equity. If they do not, you are reading a draft or a summary, not the audited statement.
- Separate current from non-current on both sides. Liquidity lives in the short-term columns; durability lives in the long-term ones.
- Calculate the current and quick ratios. Ask whether the company can meet its near-term obligations without selling assets at a loss.
- Calculate debt-to-equity. Ask how much of the business is financed by lenders versus owners.
- Compare the current period to the prior one. A single snapshot is a position; two snapshots are a direction.
This is the answer to what to look for in balance sheet analysis as part of stock analysis. The balance sheet rarely tells you a stock is cheap. It tells you whether the company can afford to wait for its thesis to play out, which is exactly the quality you want when a position moves against you for reasons that have nothing to do with the business.
Balance sheet analysis vs income statement analysis
The balance sheet analysis vs income statement analysis question comes up because the two statements answer different questions and people often expect one to do the other's job.
The income statement covers a period and answers whether the company made money. The balance sheet covers a single date and answers what the company is worth and what it owes. A business can post a strong quarter on the income statement while its balance sheet deteriorates, because rising profit can hide rising debt or shrinking cash. The reverse also happens: a quiet income statement can sit on a fortress balance sheet that lets the company outlast competitors during a downturn.
The two read best together. The income statement tells you the engine is running. The balance sheet tells you how much fuel is left and whether the chassis can take the strain. Judging a company on profit alone, without the balance sheet, is how investors get surprised by businesses that looked profitable right up until the debt came due.
Red flags a balance sheet analysis should surface
A useful balance sheet analysis is partly a search for warning signs. These are the common balance sheet analysis red flags worth treating as questions rather than verdicts.
- Current liabilities consistently larger than current assets, which signals the company may struggle to cover near-term obligations.
- Debt growing faster than equity over consecutive periods, which means the business is leaning harder on lenders to fund itself.
- Receivables rising much faster than revenue, which can mean the company is booking sales it is having trouble collecting.
- Inventory swelling while sales stay flat, which often precedes write-downs.
- Goodwill that dominates the asset side, since goodwill is an accounting figure from past acquisitions, not a liquid asset you can rely on in a crisis.
None of these is automatically fatal. Each is a prompt to dig further. The skill in balance sheet analysis is not spotting a single number. It is noticing when several of these move in the same direction at once, because that is when a structural problem is usually forming.
A balance sheet analysis checklist for investors
For balance sheet analysis explained for beginners, a checklist keeps the process from becoming guesswork. Use this as a balance sheet analysis checklist for beginners and tighten it as you build experience. Take a simple balance sheet analysis example: a company with rising cash, falling debt, and steady receivables relative to sales is strengthening, even if its profit is flat. Run that picture against the list below.
- Does the equation balance, and is the statement audited?
- Is the current ratio above 1, and is the quick ratio reassuring once inventory is removed?
- Is debt-to-equity reasonable for the company's industry, not just low in the abstract?
- Are receivables and inventory growing in line with revenue, not ahead of it?
- Is equity rising over time through retained earnings, or is it being eroded?
- Has the position improved, held, or weakened versus the prior period?
A balance sheet analysis example for investors is most useful when you run the same checklist on a peer in the same industry. Absolute numbers mislead across sectors; relative numbers within a sector tell you who is the stronger operator. That comparison is where balance sheet analysis stops being an academic exercise and starts informing an actual decision.
FAQs
What is balance sheet analysis in simple terms? It is the process of reading a company's assets, liabilities, and equity at one point in time to judge how solvent and liquid it is. You compare what the company owns against what it owes to see whether its financial position is strong, stable, or deteriorating.
What is the main balance sheet analysis formula? The anchor is the accounting identity: assets equal liabilities plus equity. The interpretive work comes from ratios built on those figures, mainly the current ratio, the quick ratio, and the debt-to-equity ratio, each of which reframes the raw numbers as a question about liquidity or leverage.
How does balance sheet analysis help stock analysis? It tells you whether the company behind the stock can survive a difficult period without forced selling or dilution. A strong balance sheet gives a position the time it needs to work, which matters most precisely when the price is moving against you for reasons unrelated to the business.
What is the difference between balance sheet analysis and income statement analysis? The balance sheet measures financial position on a single date; the income statement measures performance over a period. One shows what the company is standing on, the other shows what it earned, and reading them together prevents the surprise of a profitable company that quietly ran out of room.
Related reading
Balance sheet analysis is one leg of reading a company. Pair it with income statement analysis to see how performance over time interacts with financial position, and with cash flow analysis to confirm that reported profits are actually turning into cash. Read alongside a study of financial ratios to sharpen the interpretation step, and revisit the same company across several periods so a single snapshot becomes a trend you can act on.
Worth the read?


