
Cash Flow Analysis — Reading the Money, Not the Story
Cash flow analysis reads the real money moving through a business — so you can tell durable companies from profitable-looking ones before the market does.

Cash flow analysis is the process of tracing the actual money that moves into and out of a business across operations, investing, and financing, so you can judge whether it can fund itself without borrowing or selling assets. Earnings describe how a company wants to be seen. Cash flow analysis shows what the company can pay for. When the two disagree, the cash is usually telling the truth.
Most write-ups treat this as a corporate-treasury task. The more useful lens, for anyone reading a stock, is closer to position management: you are sizing how durable the business is before you commit. A company can post record profit and still run short of cash, and the gap between the two is where careful readers find their edge.
What cash flow analysis means
Cash flow analysis is the structured reading of a company's cash flow statement. The statement records real cash movement over a period, separated into three categories. Net income, by contrast, includes non-cash items and timing assumptions. The cash flow statement strips those out and reports what actually settled.
The distinction matters because accounting profit is an estimate built on accruals. Revenue can be booked before a customer pays. Expenses can be spread across years. None of that changes the bank balance on a given day. Cash flow analysis is how you check the estimate against reality.
The goal is not to memorize line items. The goal is to answer a few direct questions:
Does the core business generate cash on its own?
Is the company investing for the future or shrinking?
Is it funding operations with debt because the operations cannot fund themselves?
Those answers shape how you read everything else.

The three components of cash flow analysis
Every cash flow statement splits activity into three sections. Reading them in order tells a story about how the business actually operates.
Operating cash flow. Cash generated by the core business: money in from customers, money out for suppliers, payroll, rent, and taxes. This is the section that matters most. A healthy company produces consistent, positive operating cash flow because the business itself works.
Investing cash flow. Cash spent on or received from long-term assets: buying equipment, building facilities, acquiring other companies, or selling off property. Negative investing cash flow is often a good sign — it usually means the company is reinvesting in growth.
Financing cash flow. Cash exchanged with lenders and owners: issuing or repaying debt, selling stock, buying back shares, paying dividends. This section shows how the company funds the gap between what operations produce and what the business consumes.
The sequence is the insight. Operations should fund the company. Investing should reflect deliberate reinvestment. Financing should be a choice, not a lifeline. When financing inflows consistently prop up weak operating cash flow, the structure is fragile no matter how the income statement reads.
How cash flow analysis differs from a profit and loss statement
The profit and loss statement and the cash flow statement answer different questions, and confusing them is a common, expensive mistake.
A profit and loss statement measures profitability over a period using accrual accounting. It recognizes revenue when earned and expenses when incurred, regardless of when cash changes hands. Cash flow analysis measures liquidity: whether the cash to cover obligations is actually present.
The practical differences are worth holding side by side.
Dimension | Profit and loss statement | Cash flow statement |
|---|---|---|
Core question | Is the company profitable? | Can the company pay its bills? |
Accounting basis | Accrual | Cash |
Non-cash items | Includes depreciation, accruals | Excludes or adds them back |
Revenue timing | When earned | When collected |
Hardest to manipulate | Easier to dress up | Harder to disguise |
A business can show strong profit while cash drains away. The usual culprits are familiar:
Sales booked but not yet collected, inflating revenue ahead of cash.
Inventory piling up, tying cash in goods that have not sold.
Capital spending outrunning the income the business produces.
It can also show a loss while cash builds, as a company collecting old receivables during a slow quarter sometimes does. Reading only one statement gives you half the picture. Cash flow analysis supplies the other half.
How to do a cash flow analysis, step by step
A disciplined cash flow analysis follows the same sequence every time. The repetition is the point. Consistency is what lets you compare one company against another and one period against the last.
Start with operating cash flow. Confirm it is positive and reasonably stable across several periods. A single strong quarter means little; a trend means something.
Compare operating cash flow to net income. They should track each other over time. When net income climbs but operating cash flow stalls or falls, ask why. The answer is usually in receivables or inventory.
Read investing cash flow for intent. Distinguish growth spending on new capacity from forced asset sales raising cash to survive. The numbers can look similar; the meaning is opposite.
Read financing cash flow for dependence. Note whether the company is repaying debt and returning capital, or raising new debt and issuing shares to stay afloat.
Calculate free cash flow. Operating cash flow minus capital expenditures. This is the cash left over after the business funds its own maintenance and growth.
Compare across periods and peers. A single statement is a snapshot. The signal lives in the direction of travel and in how the company stacks up against similar businesses.
None of these steps requires advanced math. They require the discipline to run the same checklist every time, especially when a company's narrative is exciting enough to make you want to skip a step.
The formula that does most of the work
Most cash flow analysis ratios are variations on one idea: how much cash is left after the business pays for what it needs to keep running. The central formula is free cash flow.
Free cash flow = operating cash flow − capital expenditures
Free cash flow is the cash a company can use without starving the core business — to repay debt, pay dividends, buy back shares, or build a reserve. A company generating consistent free cash flow has options. A company that does not is dependent on outside capital, and dependence is fragility.
A few supporting ratios add context:
Operating cash flow ratio — operating cash flow divided by current liabilities. It shows whether short-term obligations can be covered by the cash the business produces.
Cash flow margin — operating cash flow divided by revenue. It shows how much of each sales dollar actually converts to cash.
Free cash flow yield — free cash flow divided by market value. It frames how much cash the business throws off relative to its price.
None of these numbers mean much in isolation. They mean something when you watch them across several periods and the trend either holds or breaks.
How cash flow analysis sharpens stock analysis
This is the angle most explainers skip, and it is the one that matters if you are reading a company as an investor rather than running its books. Cash flow analysis is one of the cleaner windows into business quality because cash is harder to manage toward a target than reported earnings.
Much of the education available online treats liquidity and cash quality as buzzwords, repeated long before the people using them have read enough statements to know what normal looks like. The way past that is unglamorous: read the cash flow statement of every company you are serious about, period after period, until the patterns become familiar.
When you do, a few questions consistently separate durable businesses from fragile ones.
Does operating cash flow reliably exceed net income, or does the company keep reporting profit it cannot collect?
Is free cash flow positive and growing, or is the company funding dividends and buybacks with borrowed money?
Does financing cash flow show a company returning capital, or one perpetually raising it?
A business that converts earnings into cash quarter after quarter has a real model underneath it. One that does not may still have a great story. The cash flow statement is where you find out which is which before the market does.
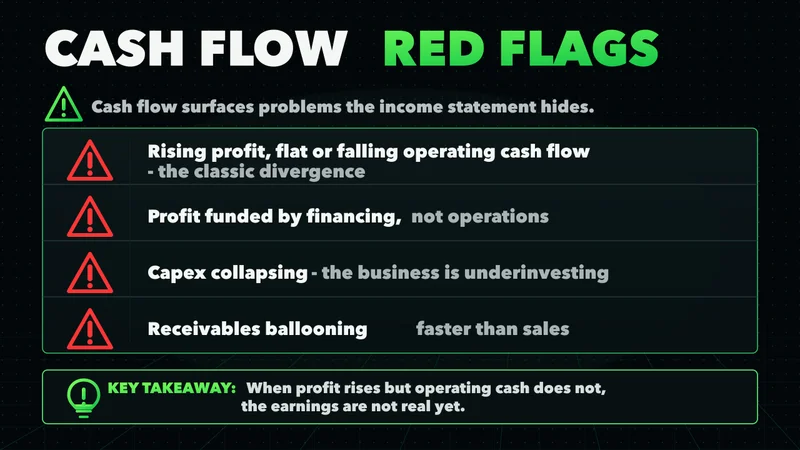
Common cash flow analysis red flags
The value of cash flow analysis is partly defensive. It surfaces problems the income statement hides. A few patterns deserve immediate attention.
Rising profit, flat or falling operating cash flow. The classic divergence. It often means revenue is being booked faster than it is collected, or earnings are being supported by accounting choices rather than cash.
Operating cash flow propped up by one-time items. A large tax refund, an asset sale, or a sudden swing in payables can inflate a single period. Strip those out and check what the core business produced.
Free cash flow consistently negative while debt rises. A company that cannot fund itself and keeps borrowing is buying time, not building strength.
Dividends or buybacks larger than free cash flow. Returning capital you did not generate is borrowing dressed up as confidence.
Receivables and inventory growing faster than sales. Cash is being tied up in customers who have not paid and goods that have not sold.
These signals are not verdicts. A young company reinvesting heavily will show negative free cash flow for good reasons. The point of cash flow analysis is not to react to one number but to ask the next question and read the trend before drawing a conclusion.
A short cash flow analysis example
Consider two companies that report identical net income of 10 million dollars for the year.
The first company shows the pattern you want to see:
Operating cash flow of 12 million dollars, comfortably above net income.
Capital spending of 4 million, leaving 8 million in free cash flow.
Debt repaid and a modest dividend paid, with the cash position still growing.
The second company reports the same profit on a very different foundation:
Operating cash flow of only 3 million, because receivables ballooned as it extended generous payment terms to win sales.
A dividend still paid, funded partly by a new loan.
A cash position that shrinks even as the income statement looks strong.
Same headline profit. Very different businesses. The first earns its money; the second is financing the appearance of earning it. Cash flow analysis is what tells them apart, and the difference compounds over time.
Where cash flow analysis stops working
Cash flow analysis is a strong tool, not a complete one, and treating it as the whole answer is its own mistake. It reads cleanly for established companies with steady operations and several periods of history to compare. It reads poorly in a few specific conditions, and knowing them keeps you honest.
For an early-stage company investing aggressively, negative free cash flow is expected and says little about quality on its own. For a deeply cyclical business, a single year of weak operating cash flow can reflect the cycle rather than the company. And for any business, a single period in isolation is close to meaningless — the statement only becomes a signal across several periods read together. Lean on cash flow analysis where the business is mature and the history is long; lean on it less where the model is still forming, and never read one quarter as a conclusion.
A short cash flow analysis checklist
For a quick pass on any company, run this sequence before drawing conclusions.
Is operating cash flow positive and stable across several periods?
Does operating cash flow track net income, or has a gap opened up?
Is free cash flow positive after capital spending?
Is the company returning capital or perpetually raising it?
Are receivables and inventory growing in line with sales, not ahead of them?
Does any single period rely on a one-time item to look healthy?
If the answers hold across several periods, the business is producing real cash. If they break, that is your cue to dig deeper before committing.
FAQs
What is cash flow analysis in simple terms? It is the process of reading a company's cash flow statement to see how much actual cash moves in and out of the business across operations, investing, and financing. It tells you whether the company can pay its bills and fund itself, which reported profit alone does not.
What are the three components of cash flow analysis? Operating cash flow, investing cash flow, and financing cash flow. Operating covers the core business, investing covers long-term assets, and financing covers debt and equity. Reading them in that order shows whether operations fund the company or outside money does.
What is the difference between cash flow analysis and a profit and loss statement? A profit and loss statement measures profitability using accrual accounting, recognizing revenue and expenses when earned or incurred. Cash flow analysis measures liquidity, tracking when cash actually changes hands. A company can be profitable on paper and still run short of cash.
What is the main formula in cash flow analysis? Free cash flow, calculated as operating cash flow minus capital expenditures. It shows the cash left after the business funds its own maintenance and growth, which is the cash available to repay debt, pay dividends, or build a reserve.
What are common red flags in cash flow analysis? Profit rising while operating cash flow falls, free cash flow staying negative while debt climbs, dividends or buybacks exceeding free cash flow, and receivables or inventory growing faster than sales. Each is a reason to ask the next question rather than an automatic verdict.
How does cash flow analysis help with stock analysis? Cash is harder to manage toward a target than reported earnings, so cash flow is one of the cleaner windows into business quality. A company that consistently converts earnings into cash usually has a durable model; one that does not may have a story the cash cannot support.
How often should you run a cash flow analysis? Each time a company reports, and always across several periods rather than one. A single statement is a snapshot, and the signal lives in the direction of travel, not in any one number.
What cash flow analysis leaves you with
Cash flow analysis comes down to a simple discipline: trust the money over the narrative. Operating cash flow shows whether the business works. Free cash flow shows whether it has options. The gap between profit and cash shows where the risk is hiding. Read those three things across several periods, and most of what you need to know about a company's financial health is already in front of you. The income statement tells the story the company wants to tell. The cash flow statement tells you whether it can afford to keep telling it.
Worth the read?


