
Income Statement Analysis — How to Read One
Income statement analysis means reading revenue, costs, and margins over time to judge profit quality. Here is how to read one, line by line.

Income statement analysis is the process of reading a company's revenue, costs, and profit over a period to judge how the business actually makes money and whether that quality is improving or decaying. It is not a verdict on the stock. It is a description of the engine. The number that ends up on the bottom line matters far less than the path it took to get there, and most readers stop at net income when the useful information sits in the lines above it.
A single quarter tells you almost nothing. The value shows up when you read several periods in sequence and watch the trend in margins, the mix of revenue, and the behavior of costs. That sequence is where reading becomes analysis.
What income statement analysis actually tells you
The income statement, sometimes called the profit and loss statement, reports performance across a defined window: a quarter or a full year. Income statement analysis means interpreting that report rather than just reading it top to bottom. You are asking three questions. Is revenue growing for durable reasons or one-time ones? Are costs scaling slower than sales? Is the reported profit backed by the operating business or by items that will not repeat?
The income statement analysis meaning comes down to separating signal from accounting noise. A company can post record net income on the back of a tax benefit or an asset sale and look healthier than it is. The structure of the statement is built to let you see that, if you read it in order.
The components of an income statement
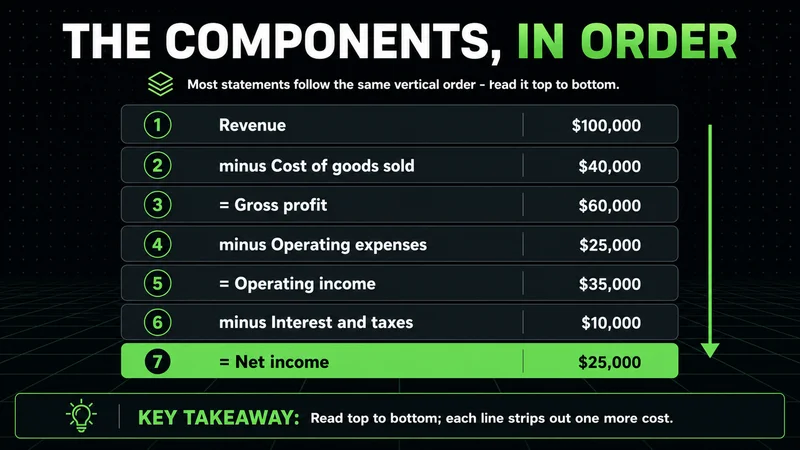
Most statements follow the same vertical order, and the income statement analysis components matter in that exact sequence:
- Revenue, the total money earned from selling goods or services before any costs.
- Cost of goods sold, the direct cost of producing what was sold.
- Gross profit, revenue minus cost of goods sold.
- Operating expenses, including selling, general, and administrative costs.
- Operating income, what the core business earns before interest and taxes.
- Net income, the final figure after interest, taxes, and any non-operating items.
Reading from the top down keeps you honest. Each line strips away another layer of cost, so by the time you reach net income you already understand which layer did the damage or carried the growth.
How to read an income statement step by step
Start with revenue and ask whether the growth is organic. Then move to gross profit and check whether the margin between revenue and cost of goods sold is stable. Next, look at operating income, because that is the cleanest measure of the underlying business. Only then read net income, and when you do, scan for non-operating items that inflated or depressed it.
The discipline is to read the statement the same way every time. Consistency in process is what turns a glance into analysis.
Horizontal and vertical analysis: the core formulas
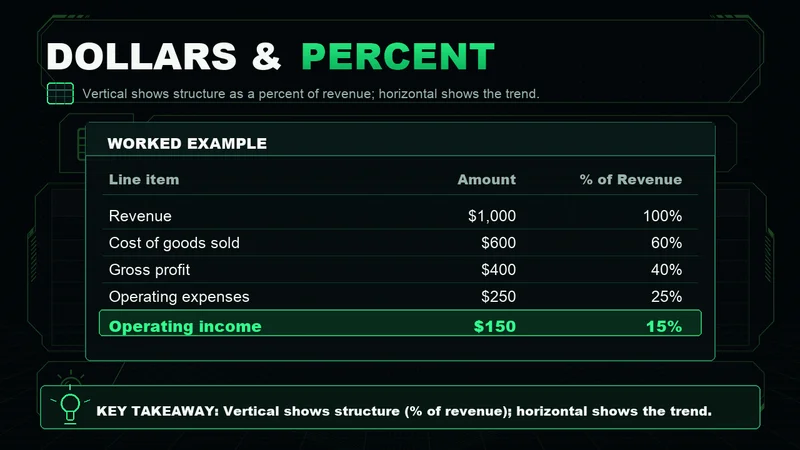
Two methods do most of the work. Horizontal analysis compares each line across periods to measure change. Vertical analysis expresses each line as a percentage of revenue so you can compare structure regardless of company size.
The income statement analysis formula set is short and worth memorizing:
- Horizontal growth: (Current period − Prior period) ÷ Prior period.
- Common-size line: Line item ÷ Total revenue.
- Gross margin: Gross profit ÷ Revenue.
- Operating margin: Operating income ÷ Revenue.
- Net margin: Net income ÷ Revenue.
Vertical analysis is the more revealing of the two. When you common-size two competitors, you stop comparing dollars and start comparing how each business converts a sale into profit.
An income statement analysis example
Consider a simplified retailer over one year, expressed both in dollars and as a percentage of revenue.
| Line item | Amount | Percent of revenue |
|---|---|---|
| Revenue | 1,000 | 100% |
| Cost of goods sold | 600 | 60% |
| Gross profit | 400 | 40% |
| Operating expenses | 250 | 25% |
| Operating income | 150 | 15% |
| Net income | 110 | 11% |
The common-size view is the income statement analysis example most worth studying. A 40% gross margin and a 15% operating margin tell you the business keeps a healthy share of every dollar after direct costs and still has room after overhead. If next year's gross margin slips to 36% while revenue grows, the growth is being bought with discounting, and the trend matters more than the larger top line.
Interpreting margins and revenue quality
The income statement analysis interpretation step is where most of the judgment lives. Rising revenue with falling operating margin usually means the company is spending more to win each incremental sale. Stable margins on flat revenue can be healthier than rising revenue on collapsing margins.
Revenue quality is the other half. Recurring revenue from existing customers is worth more than a one-time contract that will not repeat, and the statement rarely labels this directly.
Income statement analysis red flags
A few patterns deserve attention. Treat the common income statement analysis red flags as prompts to dig, not as automatic disqualifiers.
- Net income rising while operating income falls, which points to non-operating items doing the lifting.
- Revenue growth that consistently outpaces cash collection over several periods.
- Margins held up only by cutting research or maintenance spending.
- Frequent one-time charges that appear every quarter and stop being one-time.
The practical income statement analysis checklist is simple: read top to bottom, common-size every line, compare at least three periods, and flag any quarter where net income and operating income disagree on direction.
Reading the statement as a trading edge
For anyone trading equities, the income statement is context, not a trigger. It tells you whether a name has the operating quality to sustain a move or whether a rally is running on narrative. A business with expanding operating margins and clean revenue growth tends to attract durable institutional positioning, and that positioning is what holds price up on pullbacks.
Most traders do not have a strategy problem; they have a context problem. They take a clean technical setup in a company whose margins are quietly eroding and wonder why the move fails to hold. The statement would have told them the operating story was weakening before price did.
This only works as background. The framework breaks down in two conditions. The first is a single distorted quarter, where a one-off charge or gain makes the trend unreadable until the next report. The second is a narrative-driven name trading on future expectations rather than current results, where the market prices a story the income statement has not yet shown. In both cases the statement stops being predictive, and forcing a read on it is just gambling with better vocabulary.
Income statement vs balance sheet analysis
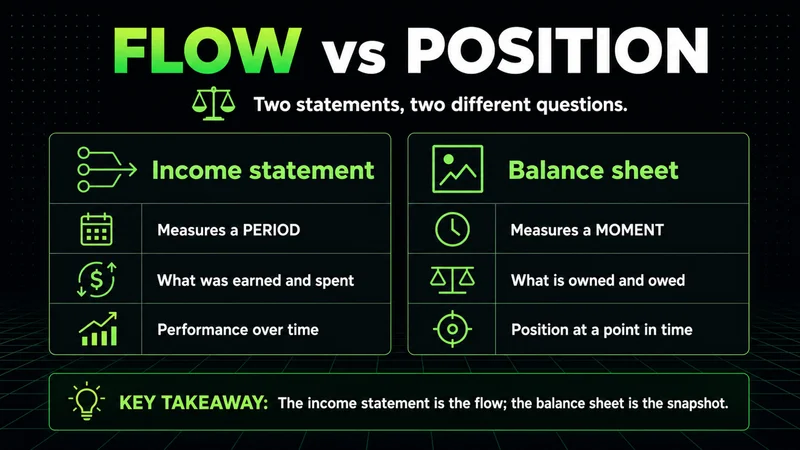
The two statements answer different questions. Income statement vs balance sheet analysis is the difference between flow and position. The income statement measures performance over a period: what the company earned and spent. The balance sheet measures position at a single moment: what it owns and owes.
A company can show strong net income on the income statement while carrying debt and thin cash on the balance sheet. Reading one without the other leaves a blind spot. Performance and position have to agree before you trust either.
FAQs
What is income statement analysis in simple terms? It is reading a company's revenue, costs, and profit over time to judge how it makes money and whether the quality of that profit is improving. The goal is to understand the trend behind the bottom-line number, not just the number itself.
What is the difference between horizontal and vertical analysis? Horizontal analysis compares each line item across periods to measure change over time. Vertical analysis expresses each line as a percentage of revenue, so you can compare the structure of one company against another regardless of size.
What are the most useful income statement margins? Gross margin, operating margin, and net margin. Operating margin is usually the cleanest, because it reflects the core business before interest, taxes, and one-time items distort the picture.
Related reading
Income statement analysis is one piece of reading a company. Pair it with balance sheet analysis to see financial position, and with cash flow analysis to confirm that reported profit is converting into actual cash. Together the three statements give you the full operating picture instead of a single angle on it.
Worth the read?


