
Debt to Asset Ratio — What It Really Tells You
The debt to asset ratio shows how much of a company's assets are funded by debt. Here is how to calculate, interpret, and stress-test it.

The debt to asset ratio measures how much of a company's assets are funded by debt rather than equity. You calculate it by dividing total liabilities by total assets. A reading of 0.4 means 40% of the asset base was financed with borrowed money, and the remaining 60% belongs to shareholders. That single number frames the question every analyst eventually returns to: how much of this business does the company actually own free and clear?
Most explainers stop at the formula and a vague rule that lower is safer. That treatment is incomplete. The ratio is a starting point for a conversation about risk, not a verdict on its own. A number that looks dangerous in one industry is normal in another, and a clean reading can still hide real fragility. Read in context, it tells you something useful. Read in isolation, it tells you almost nothing.
What the debt to asset ratio measures
The debt to asset ratio answers a structural question. Of everything the company controls — cash, inventory, property, equipment, receivables — what share was paid for with money that has to be returned? Creditors hold a claim on assets ahead of shareholders, so the higher the ratio, the more of the balance sheet is spoken for before owners see anything.
Think of it the way a disciplined trader thinks about exposure. The asset base is the position. The debt is the borrowed portion of that position. A higher ratio means more leverage, and leverage cuts both ways. When asset values rise or cash flow holds, debt amplifies returns to equity. When conditions turn, the same debt amplifies losses and narrows the margin for error. The ratio is a quiet read on how much room the company has before a bad stretch becomes a solvency problem.
The debt to asset ratio formula and how to calculate it
The formula is direct:
Debt to Asset Ratio = Total Liabilities / Total Assets
Both figures sit on the balance sheet. Total liabilities include everything owed — short-term payables, accrued expenses, and long-term borrowings. Total assets is the bottom line of the asset section. Divide one by the other and you get a decimal, often expressed as a percentage.
A worked example makes it concrete. Suppose a company reports the following:
Total assets: $500 million
Total liabilities: $200 million
The debt to asset ratio is 200 / 500, or 0.40. Forty percent of the asset base is financed by liabilities; the other 60% is equity. The calculation never changes. The interpretation is where the work actually lives.
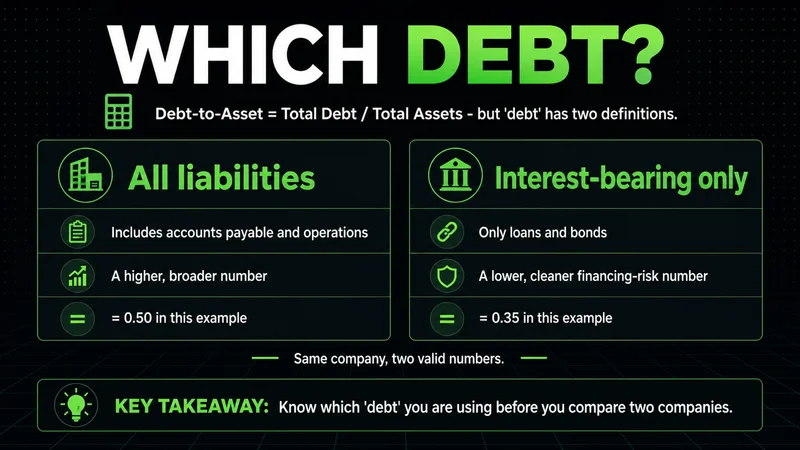
One practical note. Some analysts narrow "debt" to interest-bearing borrowings only and exclude operational liabilities like accounts payable. That produces a lower, cleaner number focused on financing risk. Neither approach is wrong, but you have to know which one you are using before you compare two companies, or the comparison is meaningless.
What is a good debt to asset ratio
There is no universal good number, and anyone who quotes one without naming an industry is guessing. As a rough orientation, a ratio below 0.5 means liabilities are less than half of assets, and many lenders treat readings under 0.4 as conservative. A ratio approaching 1.0 means debt finances almost the entire asset base, which is difficult to sustain because a single weak period can push the company toward default.
The word "good" only means something against a peer group. Capital-intensive sectors such as utilities and telecom routinely run high ratios because stable, regulated cash flows support heavy borrowing. A software company carrying the same ratio would look reckless, because its cash flows are far less predictable. Compare a company to its direct competitors and to its own history, never to an abstract benchmark.
A ratio that is too low carries its own message. It can signal a management team that refuses to use debt even when cheap financing would raise returns for shareholders. Capital structure is a decision, and avoiding leverage entirely is still a decision with a cost.
How investors actually use the debt to asset ratio
In practice, the ratio is a filter, not a conclusion. It flags where to look harder. A high reading sends you to the cash flow statement to check whether operating cash comfortably covers interest and upcoming maturities. A company can carry heavy debt and remain stable if cash generation is strong and steady. Another can carry modest debt and still be fragile if its earnings swing hard with the cycle.
This is where context decides everything, and it mirrors how risk works on a live position. The number on the screen is never the whole story; the conditions around it are. Trading without context is gambling with better vocabulary, and reading a balance sheet without context is the same mistake in a slower form. Pair the ratio with interest coverage, the maturity schedule, and the cyclicality of the business, and it starts to earn its place in the analysis.
A short checklist keeps the read honest:
Compare the ratio to direct industry peers, not a generic threshold.
Track the trend across several years, since direction often matters more than the level.
Confirm whether "debt" includes all liabilities or only interest-bearing borrowings.
Cross-check against interest coverage and free cash flow before drawing a conclusion.
Debt to asset ratio vs debt to equity ratio
These two ratios describe the same capital structure from different angles. The debt to asset ratio measures debt against the entire asset base. The debt to equity ratio measures debt against shareholder equity alone, so it isolates how aggressively a company funds itself relative to owner capital. Debt to equity tends to react more sharply, because a thin equity base produces a large ratio fast. Many analysts read both together: the asset version for the broad picture, the equity version for the intensity of the leverage.
When the debt to asset ratio misleads you
The ratio leans entirely on book values, and book values drift from economic reality. Assets sit on the balance sheet at historical cost, which can understate the true worth of property bought decades ago or overstate goodwill from an acquisition that has since soured. A clean-looking ratio built on inflated asset values is not the reassurance it appears to be.
The gaps matter as much as the figures. Operating leases, pension obligations, and other off-balance-sheet or recently reclassified items can leave real commitments underrepresented depending on the reporting standard. Intangible-heavy businesses distort the read further, since brands and software carry economic value the balance sheet captures poorly. The ratio works cleanly for asset-heavy, stable companies. For an asset-light business in a volatile sector, the same number means far less, and treating it as precise is its own kind of risk.
FAQs
What is the debt to asset ratio in simple terms? It is the share of a company's assets paid for with borrowed money. You divide total liabilities by total assets, so a ratio of 0.4 means 40% of the asset base was financed by debt and the rest by equity.
What is a good debt to asset ratio? There is no single good number. Readings below 0.4 are often viewed as conservative, and a ratio near 1.0 signals heavy reliance on debt. What counts as healthy depends entirely on the industry and the stability of the company's cash flows.
What is the difference between the debt to asset ratio and the debt to equity ratio? Both describe the same capital structure. The debt to asset ratio compares debt to total assets, while the debt to equity ratio compares debt to shareholder equity alone. The equity version reacts more sharply when a company carries a thin equity base.
Worth the read?


