
Relative Strength Index Explained — Meaning and Limits
The relative strength index explained for traders: what it measures, how to read it in context, confirm it against price, and where the signal breaks down.
The relative strength index is a momentum oscillator that measures how fast and how far price has moved over a set number of closes, scaled between 0 and 100. Most traders treat it as a buy-and-sell trigger. That is where the trouble starts. The relative strength index describes momentum; it does not predict reversals, and the gap between those two ideas decides whether the tool helps you or quietly drains your account.
J. Welles Wilder introduced the indicator in 1978, and the math has not changed since. What has changed is how casually it gets used. A reading of 70 gets called overbought, a reading of 30 gets called oversold, and a position gets opened on that number alone. Strong trends spend long stretches above 70 or below 30 while price keeps going. If the only thing in your process is a threshold, the trend will run you over.
This is the relative strength index explained from a practitioner's seat: what it measures, how to read it in context, where it breaks, and a checklist to run before you act on it.
The relative strength index explained — what it actually measures
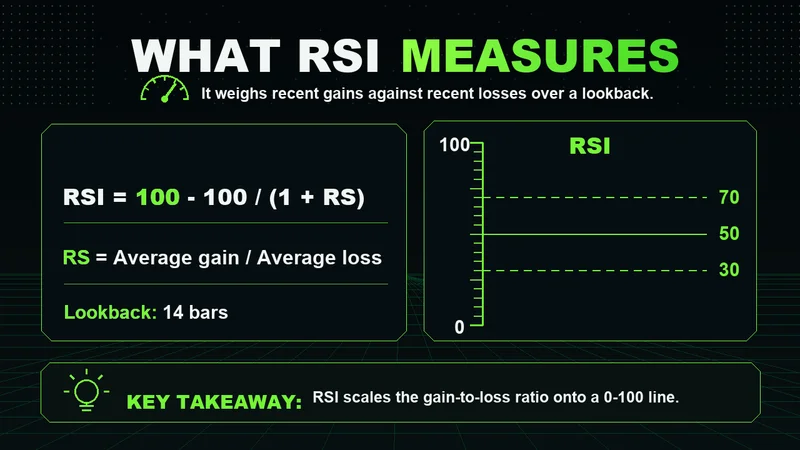
The relative strength index meaning is simpler than the name suggests. It compares the average size of recent up closes to the average size of recent down closes over a lookback period, usually 14 bars, and converts that ratio into a single line bounded by 0 and 100. When up moves dominate, the line rises. When down moves dominate, it falls.
The word "strength" causes confusion. The relative strength index is not comparing one asset against another, the way a relative strength chart compares a stock to an index. It compares an asset against its own recent behavior. A reading of 65 on NQ tells you momentum has been leaning up relative to the last 14 closes. It tells you nothing about the S&P, gold, or any peer.
That distinction matters because the relative strength index is reactive, not predictive. It is a smoothed summary of closes that already happened. By the time the line crosses 70, the move that pushed it there is in the past. You are reading momentum that exists, not forecasting momentum that will.
How the RSI indicator is built
You do not need to compute the relative strength index indicator by hand, but understanding the formula tells you why it behaves the way it does. The calculation runs in two steps.
Average the gains and average the losses over the lookback period to get a relative strength value, the ratio of average gain to average loss.
Normalize that ratio into the 0-100 range so the output stays bounded no matter how large the price swings get.
Two consequences fall out of that math. First, the line is smoothed, so a single sharp bar barely moves it; momentum has to persist to push the reading to an extreme. Second, the lookback length controls sensitivity. A shorter period reacts faster and prints more extremes. A longer period is slower and prints fewer. The default 14 is a compromise, not a law.
Reading overbought and oversold without getting trapped
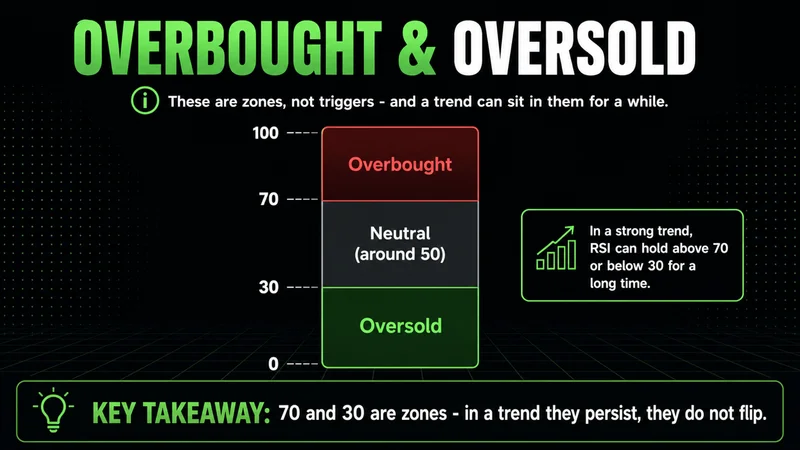
The most repeated relative strength index trading signal is the overbought and oversold cross: sell above 70, buy below 30. In a range, that logic often holds because price keeps reverting to the middle. In a trend, it fails repeatedly.
During a strong uptrend, the relative strength index can hold above 70 for days while price grinds higher. Shorting every cross above 70 means fighting the trend on every bar. The opposite happens in a downtrend, where the line can sit under 30 far longer than a counter-trend buyer can stay solvent.
A more durable read uses the indicator's range as structure rather than a switch. In an uptrend, the line tends to find support in the 40 to 50 zone and stall near 80 to 90. In a downtrend, it tends to cap in the 50 to 60 zone and bottom near 10 to 20. Watching where the line holds and where it rejects tells you more about who is in control than any fixed line ever will.
Divergence and the relative strength index chart pattern that matters
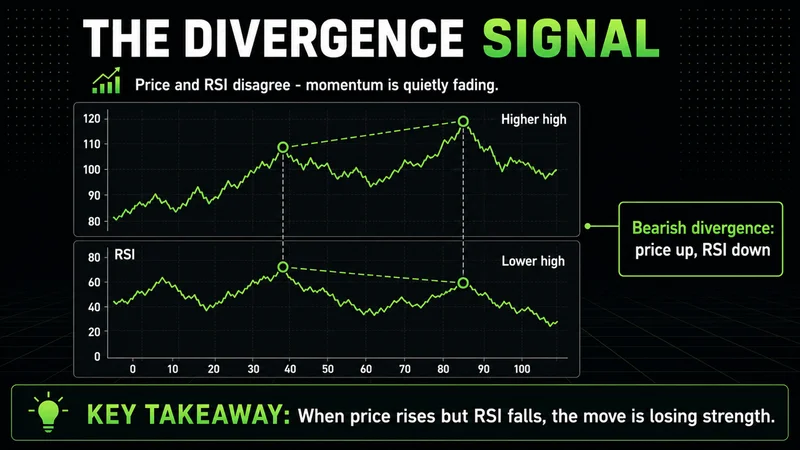
Of every relative strength index chart pattern traders track, divergence is the one worth your attention. Divergence happens when price and the indicator disagree. Price prints a higher high while the relative strength index prints a lower high, or price prints a lower low while the indicator prints a higher low. The disagreement says the momentum behind the new extreme is weaker than the momentum behind the last one.
Divergence is a warning about momentum, not a reversal signal. Markets can diverge for a long time before anything turns, and plenty of divergences resolve by the trend simply resuming. Treating divergence as an automatic entry is one of the fastest ways to stand in front of a trend that has not finished.
Wilder also described failure swings, where the line breaks a prior swing point on the indicator itself rather than on price. A failure swing is a cleaner structural read than raw divergence because it gives you a defined level on the oscillator to work against. Either way, the signal earns weight only when price structure agrees.
How to confirm the relative strength index before you act
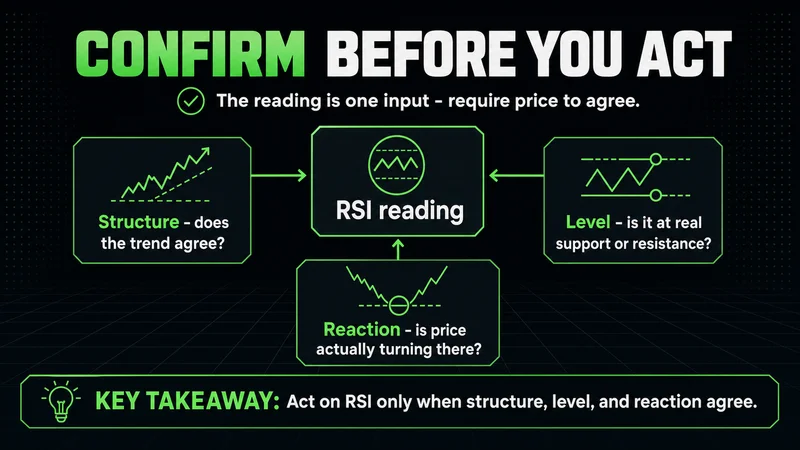
How do you confirm the relative strength index before trading instead of acting on the number alone? You require agreement from price. The indicator is one input; structure, level, and reaction are the others.
Confirmation means the relative strength index reading lines up with something visible on price. An oversold print near a level that has held before, followed by a reclaim of that level, is a confirmed read. The same oversold print in open air, with no level and no reaction, is just a number. The relative strength index confirmation you want is the moment where momentum and structure point the same direction.
This is where most of the edge lives. An entry only matters when the indicator agrees with structure, liquidity, and the broader condition of the market; stripped of that context, acting on a reading is closer to guessing than to trading. The number is never the trade. The reaction at a level the number flagged is closer to one.
Relative strength index vs money flow index
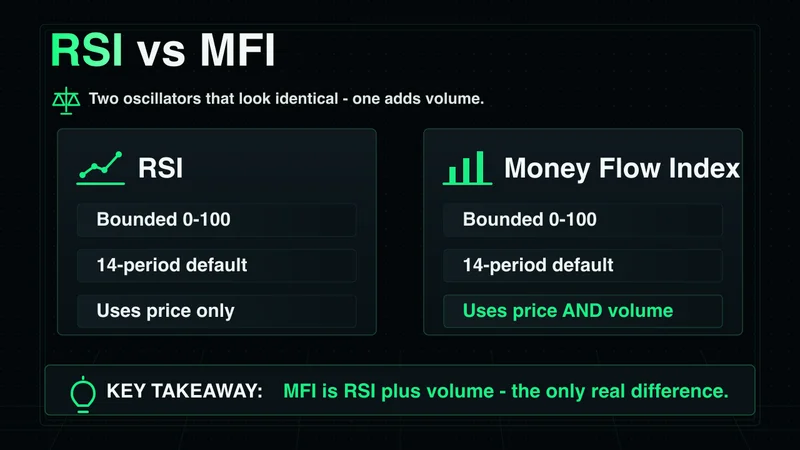
The relative strength index vs money flow index question comes up because the two oscillators look almost identical on a chart. Both are bounded momentum oscillators, both use overbought and oversold zones, and both default to a 14-period lookback. The difference is volume.
The relative strength index uses price alone. The money flow index folds volume into the calculation, weighting each move by how much was traded behind it. Because of that, the money flow index is sometimes called a volume-weighted RSI. When the two disagree, the money flow index is telling you that volume is not confirming the price move that the relative strength index sees.
Neither is strictly better. On instruments where you trust the volume data, the money flow index adds a participation filter that the relative strength index lacks. On instruments with unreliable or fragmented volume, the relative strength index is cleaner because it is not contaminated by bad volume readings. Knowing which input you trust on a given market decides which oscillator deserves the screen space.
The best timeframe for the relative strength index
There is no single best timeframe for the relative strength index. The right one is the timeframe you actually trade and execute on. The indicator behaves consistently across timeframes, but the noise and the meaning of each signal change.
The weight of a signal scales with the participation behind each bar:
Lower timeframes print overbought and oversold constantly, and most of those signals mean little because the lookback covers only minutes of price.
Higher timeframes are slower and carry more weight, because each bar represents far more participation and far more committed positioning.
Reading a daily oversold print and a one-minute oversold print as the same event is a common error.
The practical approach is to anchor context on a higher timeframe and time execution on a lower one. Let the higher timeframe relative strength index tell you the momentum backdrop, and let the execution timeframe tell you when to act inside it.
Common relative strength index mistakes that cost beginners
The most common relative strength index mistakes beginners make come from treating the indicator as a decision-maker instead of a tool.
Shorting every reading above 70 in a trend. Strong trends live in overbought territory. The cross is not a sell signal on its own.
Buying every reading below 30 in a downtrend. Catching a falling market on an oversold print alone is how counter-trend traders bleed out.
Trading divergence with no price confirmation. Divergence warns about momentum; it does not time a reversal.
Changing the lookback period to force more signals. Shortening the period to make the line touch extremes more often manufactures noise, not edge.
Reading the indicator without context. A relative strength index reading means nothing without the structure, level, and market condition around it.
Indicators are tools, not decision-makers. Most traders overload their charts searching for a certainty the market never offers, and the relative strength index gets blamed for failing at a job it was never built to do.
Here is where the tool breaks down honestly. The relative strength index reads cleanly in a balanced, ranging market, where price reverts and the overbought and oversold zones line up with turning points. In a strong, one-directional trend, that same logic inverts: extreme readings become continuation signals, not reversal signals, and a trader applying range logic to a trending market will be wrong on nearly every cross. The indicator did not fail. The condition changed, and the read did not change with it.
A relative strength index checklist before you trade
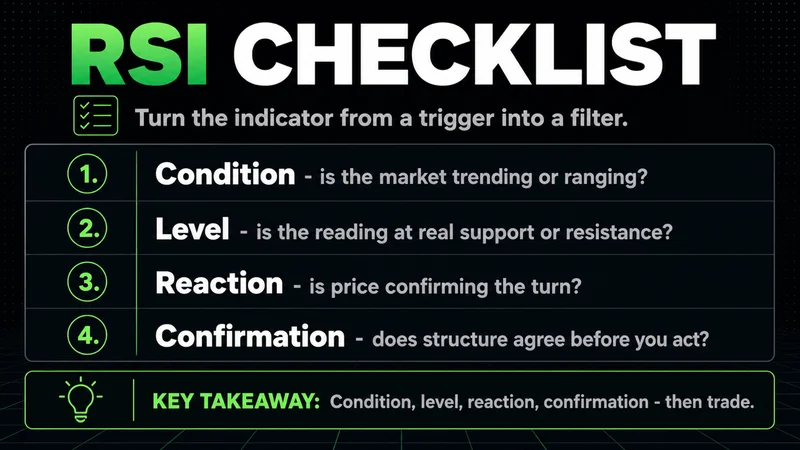
A relative strength index checklist for new traders turns the indicator from a trigger into a filter. Before acting on any reading, run through this:
Condition first. Is the market trending or ranging? The same reading means opposite things in each.
Level second. Is the reading happening at a price level that has mattered before, or in open air?
Reaction third. Did price actually react at that level, or is the signal still just a number on the oscillator?
Risk defined. Where is the invalidation, and is the position small enough that being wrong costs little?
Agreement last. Do structure, the level, and the relative strength index all point the same direction?
If any step fails, the read is incomplete. The checklist exists to keep the indicator in its lane: a momentum input that supports a decision, never the decision itself.
FAQs
What is the relative strength index in simple terms? It is a momentum oscillator that scores recent price action between 0 and 100 by comparing the average size of up closes to down closes over a lookback period, usually 14 bars. A high reading means up moves have dominated recently; a low reading means down moves have.
What is a good relative strength index reading to buy or sell? There is no universal number. Readings below 30 are traditionally called oversold and above 70 overbought, but those levels only behave like reversal points in a ranging market. In a trend they act as continuation zones, so the reading has to be read against the market condition, not in isolation.
What is the difference between the relative strength index and the money flow index? The relative strength index uses price alone, while the money flow index adds volume to weight each move by how much was traded behind it. The money flow index is effectively a volume-weighted version, useful where you trust the volume data.
What is the best timeframe for the relative strength index? The timeframe you trade and execute on. Lower timeframes print far more signals with less meaning; higher timeframes print fewer signals that carry more weight. Anchor context high and time execution lower.
Does relative strength index divergence predict reversals? No. Divergence warns that momentum behind a new extreme is weaker than before, but markets can diverge for a long time before anything turns, and many divergences resolve by the trend resuming. It needs price confirmation to matter.
The bottom line
The relative strength index is a clean, durable momentum tool that has survived since 1978 for a reason. It tells you, in one bounded line, how recent up momentum compares to recent down momentum. That is all it does, and that is enough when you respect the limit.
The traders who get value from it read it in context: condition first, then level, then reaction, with risk defined before the entry. The traders who lose money with it treat the number as a signal and skip everything around it. The relative strength index does not make decisions. It informs one. Keep it in that role and it earns its place on the chart.
Worth the read?


