
Doji Candlestick — What It Means and How to Trade It
A doji is a candlestick marking indecision. Here is what a doji means, how to confirm it, and how to trade it without forcing a reversal.
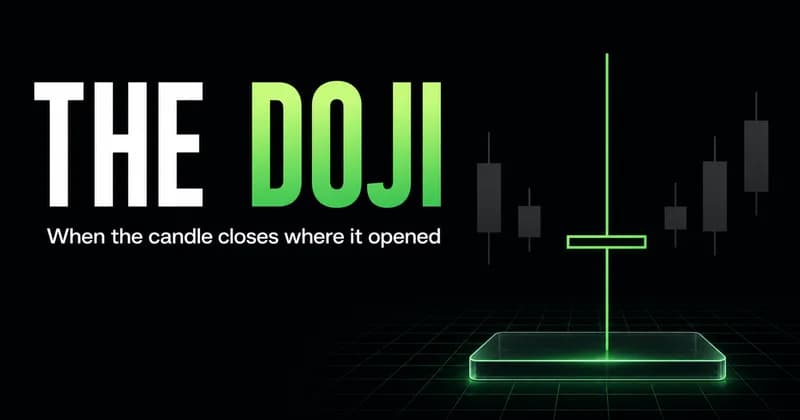
A doji is a single candle where the open and close finish at nearly the same price, leaving a tiny body with wicks on one or both sides. It marks a moment when buyers and sellers reached a standoff and neither side closed in control. That is the whole signal, and it is also the limit of the signal. A doji tells you the prior pressure stalled. It does not tell you what happens next.
Most traders treat the doji as a reversal trigger on its own. It is not. The candle is a pause, and a pause only matters in relation to the structure around it. A doji at a level the market spent hours defending is worth attention. The same candle printed in the middle of a chop range during thin overnight liquidity means almost nothing. Context decides whether the indecision is information or noise.
What a doji means on a chart
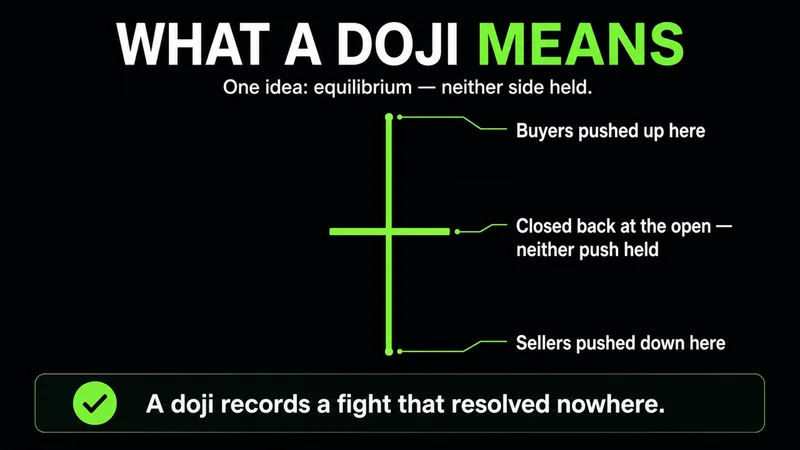
The doji meaning comes down to one word: equilibrium. Price opened, traveled in both directions, and returned to settle where it started. The wicks record how far each side pushed. The flat body records that neither push held. When you read a doji, you are reading a failed attempt to establish direction within that session.
This is why the candle shows up so often. Equilibrium is common. Markets spend large stretches of time with no clear winner, and every one of those stretches can print a doji. Treating each one as a meaningful event is the fastest way to overtrade a pattern that is mostly telling you to wait.
Liquidity drives markets more than opinions do. A doji that forms right where institutional positioning sits reads very differently from one that forms in a vacuum.
The candle earns weight from its location. After an extended trend, a doji can signal that the dominant side is running out of participants. Inside a balanced range, the same shape is just another tick of indecision. Same candle, different message, because the structure around it changed.
The structure of a doji pattern
A doji pattern has three parts worth isolating. The body is the distance between open and close, and on a clean doji it is close to zero. The upper wick measures the highest price buyers reached before sellers pushed back. The lower wick measures the lowest price sellers reached before buyers pushed back. The relationship between those three parts defines the type.
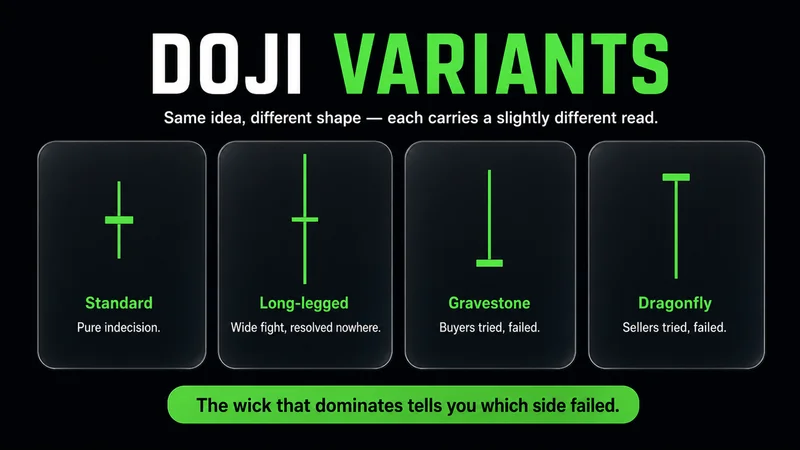
The common variants are worth knowing because each carries a slightly different read:
- Standard doji — small body, wicks of roughly equal length on both sides. Pure indecision.
- Long-legged doji — long wicks both directions, tiny body. A wide fight that resolved nowhere. Volatility was high and direction was absent.
- Dragonfly doji — open and close near the high, with a long lower wick. Sellers pressed down and buyers reclaimed the entire range.
- Gravestone doji — open and close near the low, with a long upper wick. Buyers pressed up and sellers reclaimed the entire range.
The dragonfly and gravestone carry more directional information than the standard form because the wick tells you which side got rejected. A gravestone after an uptrend shows buyers tried to extend and failed. That is a more specific message than a balanced doji that simply shows a stall.
How to identify a doji on a chart
Identifying a doji is a measurement, not a feeling. Compare the body to the candle's full range. If the body is a small fraction of the high-to-low distance, you have a doji. A useful working threshold is a body under roughly a tenth of the total range, though the exact cutoff matters less than consistency. Apply the same standard every time so you are not relabeling candles to fit a bias.
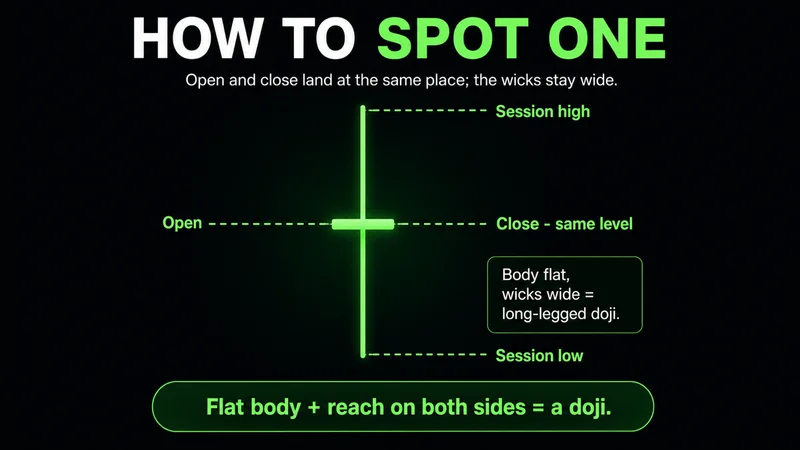
For a doji chart example, picture a daily candle that opens at 100, runs to 103, drops to 97, and closes at 100. The body is flat. The wicks are wide. That is a long-legged doji, and on a daily chart it represents a full session of two-sided pressure that resolved nowhere. Now picture the same shape on a one-minute chart at 3 a.m. The measurement is identical. The meaning is not, because the participation behind it is thin and the level it formed at carries no weight.
This is the part most guides skip. The shape is easy to spot. The context that makes it tradable is the harder read, and it is the only part that matters. Two traders can flag the exact same doji and reach opposite conclusions, because one read the level it formed at and the other read only the candle. The measurement is shared. The judgment is not.
What the best timeframe for doji analysis is
Higher timeframes produce more reliable doji signals because each candle aggregates more participation. A doji on the daily chart represents a full session of decisions from a broad set of participants. A doji on a one-minute chart represents 60 seconds, often from a thin pool of orders. More participation behind the candle means the indecision it records is more likely to be real.
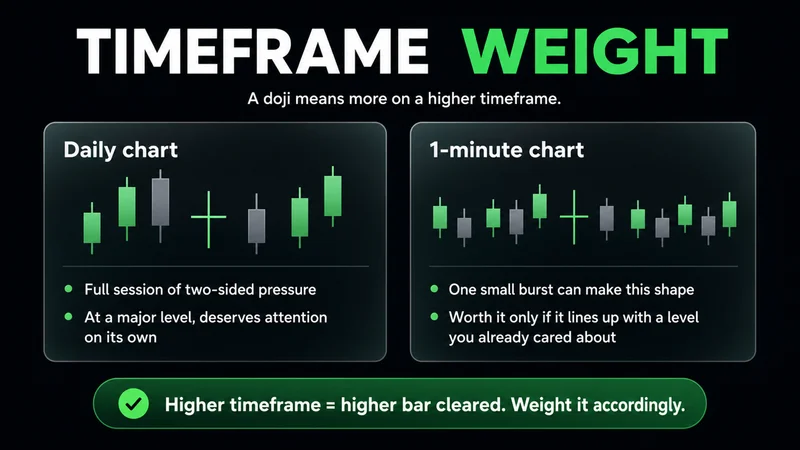
This does not mean lower timeframes are useless. It means the bar for acting on them is higher. A doji on the daily at a major level deserves attention on its own. A doji on the one-minute deserves attention only when it lines up with a higher-timeframe level you already cared about. The candle does not change. The weight you assign it should.
How to confirm a doji before entering a trade
The doji confirmation comes from the candle after the doji, not from the doji itself. The doji says pressure stalled. The next candle says which side stepped in. Until that candle prints, you are guessing. This is the single most important habit when trading the pattern, and it is the one most beginners skip.
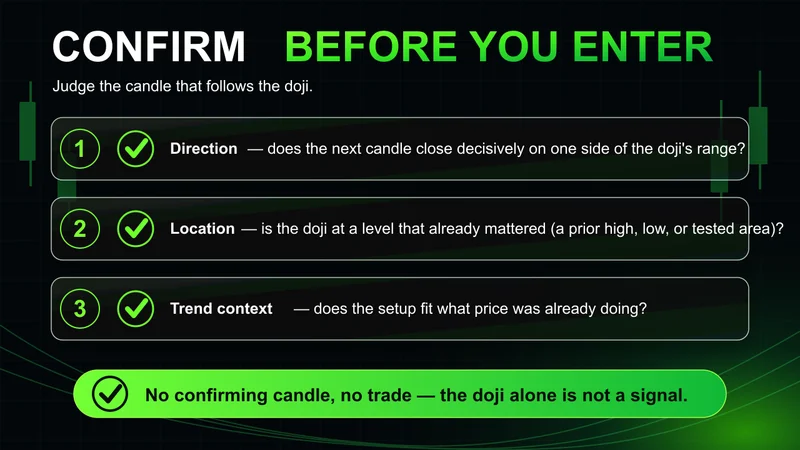
A practical confirmation checklist, applied to the candle that follows the doji:
- Direction — does the next candle close decisively on one side of the doji's range?
- Location — is the doji sitting at a level that already mattered, such as a prior high, a prior low, or a tested area?
- Trend context — did an extended move precede the doji, giving the stall something to reverse?
- Participation — is volume or activity meaningful, or is this thin-session noise?
When the answers line up, the doji becomes a usable reference point for risk. When they do not, the candle is just a pause, and the correct action is to wait. Waiting is part of the job. Forcing an entry off an unconfirmed doji is how a neutral candle turns into a loss.
How a doji works as a reversal signal
A doji reversal signal is real, but it is conditional. The candle reverses nothing by itself. What it can mark is the point where a trend's dominant side ran out of fresh participants, and the confirming candle then shows the other side taking over. The doji is the pause. The reversal is the move that follows, and only the follow-through confirms it.
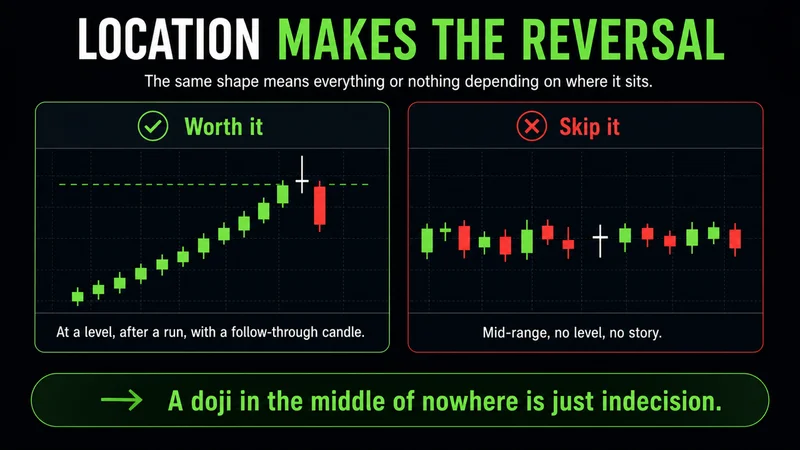
The location is what separates a reversal-worthy doji from a meaningless one. A gravestone doji at the top of an extended rally, into a prior high, with a strong bearish candle behind it, is a structurally sound short reference. A balanced doji in the middle of a range carries none of that. The shape can be identical. The trade quality is not.
This is where the pattern breaks down for most people. They see the candle, assume reversal, and enter before the structure has done anything. A doji only points toward reversal when the trend was extended, the level was meaningful, and the next candle confirmed the shift. Strip any of those away and you are trading a shape, not a setup.
How a doji affects trading risk and reward
The useful thing about a doji is not prediction. It is risk definition. The candle's high and low give you a clean, objective level for invalidation. If you act on a bullish read after a dragonfly doji, the low of that doji is your line. Break it and the read was wrong. That is a defined invalidation built directly into the candle.
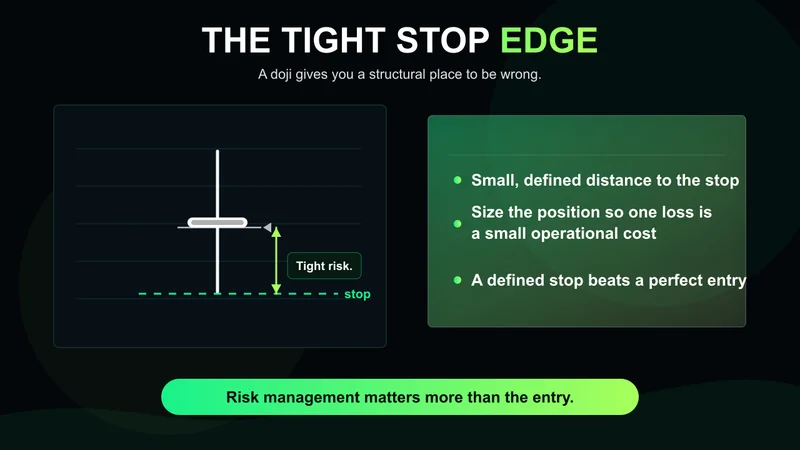
This is the part worth keeping. A doji gives you a tight, structural stop reference, which means you can size the position so a single loss stays a small operational cost rather than an emotional event. Risk management matters more than the entry. A mediocre doji entry with a defined stop and proper sizing survives. A perfect-looking doji entry with no defined risk eventually does damage.
Use the candle for what it offers. It defines a level. It does not define a direction. Most blown accounts do not start with a bad pattern read; they start with a position sized too large to survive being wrong. The doji helps here precisely because its invalidation is so clean, but only if you let that level set the size instead of forcing the size and hoping the level holds.
Doji vs hammer and the spinning top
The doji vs hammer comparison trips up newer traders because the shapes overlap. A hammer has a small but real body near the top of its range with a long lower wick. A dragonfly doji is the limit case where that body shrinks to nearly nothing. The distinction is whether a body exists at all. A hammer shows a slight close in one direction. A doji shows no meaningful close.
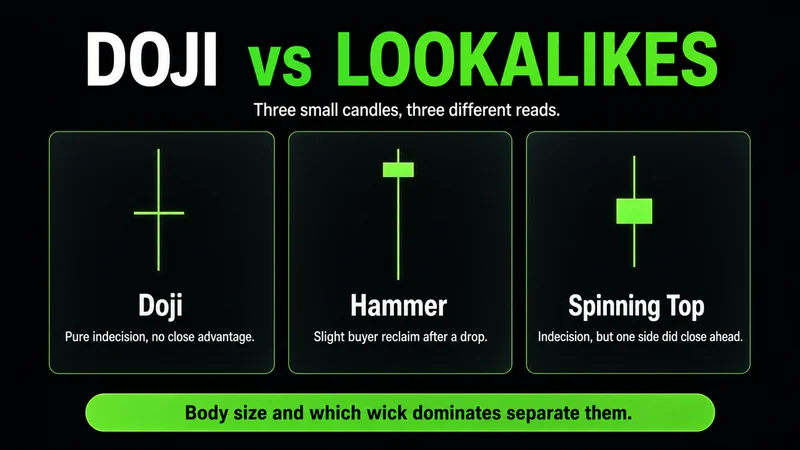
The spinning top causes similar confusion. Here is the practical separation:
| Candle | Body | Wicks | Read |
|---|---|---|---|
| Doji | Near zero | One or both sides | Pure indecision, no close advantage |
| Hammer | Small, near top | Long lower wick | Slight buyer reclaim after a drop |
| Spinning top | Small but visible | Both sides, moderate | Indecision with a faint directional lean |
The doji vs hammer explained simply: the hammer keeps a body, the doji does not. In live trading the difference rarely changes the plan, because both still require the next candle to confirm. The label matters less than the location and the follow-through.
Common doji mistakes beginners make
The doji mistakes that cost beginners the most are predictable, and all of them come from treating the candle as an answer instead of a question.
- Trading every doji. The candle is common. Acting on each one is overtrading a signal that is mostly telling you to wait.
- Skipping confirmation. Entering on the doji itself, before the next candle shows which side took over, is guessing dressed up as analysis.
- Ignoring location. A doji away from any meaningful level carries no edge, regardless of how textbook the shape looks.
- Forcing direction. A balanced doji is neutral. Assigning it a bullish or bearish bias to fit an existing position is bias, not reading.
- Trusting thin-session dojis. A clean doji on low overnight liquidity is shape without substance.
Most traders do not have an analysis problem with the doji. They have a discipline problem. The pattern is simple to read. The hard part is sitting on your hands when the context is not there, and that is exactly where the edge lives.
A doji checklist for new traders
Before acting on any doji, run a short doji checklist. If a line fails, the correct response is to wait, not to lower the standard.
- Is the body genuinely small relative to the full candle range?
- Did an extended move precede it, giving the stall context?
- Is it sitting at a level that already mattered?
- Is this a timeframe and session with real participation?
- Has the next candle confirmed a direction?
- Is the invalidation level defined and the position sized so a single loss stays small?
A doji explained for beginners reduces to this: the candle marks a pause, not a turn. It defines risk well and predicts nothing on its own. Trade the confirmation and the location, never the shape alone.
FAQs
What is a doji in trading? A doji is a candlestick where the open and close finish at nearly the same price, leaving a very small body with wicks on one or both sides. It signals indecision, meaning neither buyers nor sellers closed the session in control.
Is a doji bullish or bearish? A doji is neutral on its own. Its directional meaning depends on the preceding trend, its location on the chart, and the candle that confirms after it. The shape alone does not lean either way.
How do you confirm a doji before trading it? Wait for the candle after the doji to close decisively on one side of the doji's range, and check that the doji sits at a meaningful level with real participation behind it. The confirmation comes from the next candle, not the doji itself.
What is the difference between a doji and a hammer? A hammer keeps a small but real body near the top of its range with a long lower wick. A doji has almost no body at all. The hammer shows a slight close in one direction, while the doji shows no meaningful close.
What timeframe is best for doji analysis? Higher timeframes such as the daily are more reliable because each candle aggregates more participation. Lower-timeframe dojis can work, but only when they align with a higher-timeframe level you already cared about.
Why does a doji fail so often? Most doji signals fail because traders act on the shape without confirmation, location, or trend context. A doji in thin liquidity or away from a meaningful level carries no edge, no matter how clean it looks.
Worth the read?


