
Candlesticks — How to Read Them Without Fooling Yourself
Candlesticks show the open, high, low, and close in one shape. Here is how to read them in context, confirm them, and avoid the traps beginners fall into.
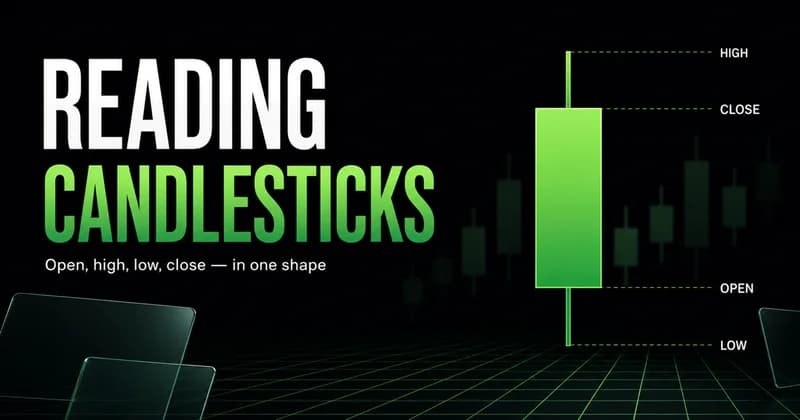
Candlesticks are a way of drawing price so you can see four things at once: where a period opened, where it closed, and the highest and lowest prices traded in between. A green candle closed above its open. A red candle closed below it. That is the entire foundation, and most beginners overcomplicate it within their first week of charting.
The useful part is not the shape. It is the story the shape tells about who was in control while the candle formed. A single candle is a small piece of evidence. Read in isolation, it is noise. Read inside structure, it starts to mean something.
What a candlestick actually shows
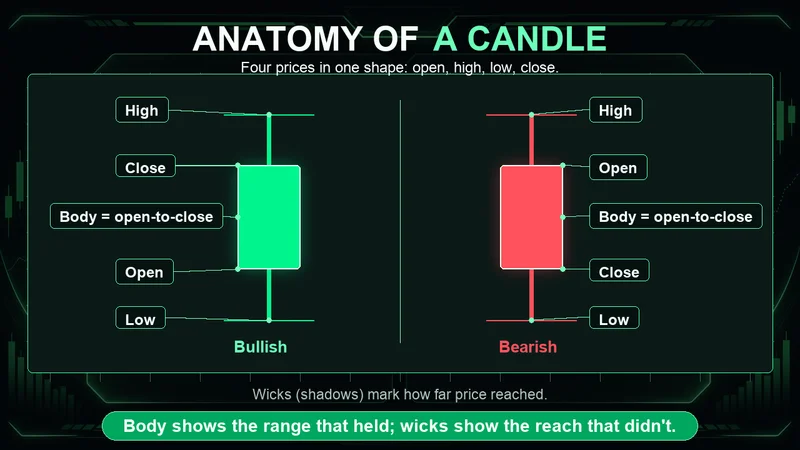
Every candlestick encodes four prices for its time period: open, high, low, and close. The thick part is the body, drawn between the open and the close. The thin lines above and below are the wicks, also called shadows, and they mark the high and the low.
When the close sits above the open, the body is usually green or hollow. When the close sits below the open, the body is red or filled. The color is only shorthand for direction over that period. It is not a signal by itself.
The proportions carry the information. A long body means one side pushed price a long way and held it into the close. A short body means the period ended close to where it started, which is indecision. A long wick means price reached a level and was rejected back from it before the close.
That rejection is the part worth studying. A long upper wick says buyers pushed price up and sellers forced it back down. A long lower wick says the opposite. The body tells you the result; the wicks tell you the fight.
Candlesticks vs. bar charts — what you gain and lose
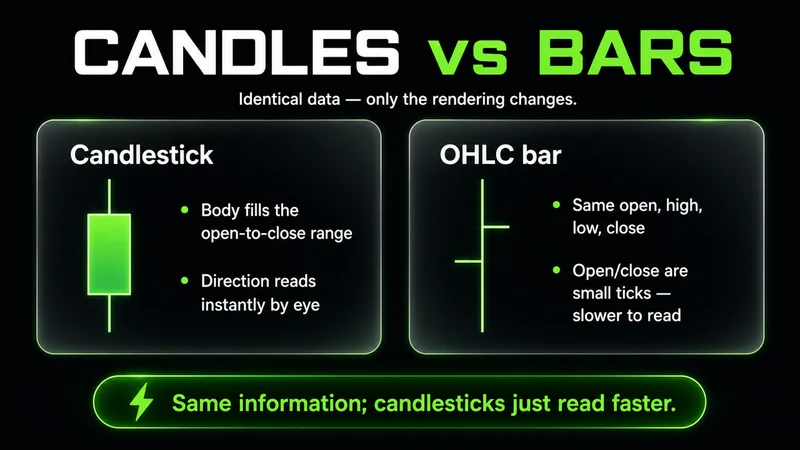
Candlesticks and bar charts contain identical data. Both show open, high, low, and close for each period. The difference is how that data is rendered, and rendering changes how fast your eye reads it.
A bar chart marks the open with a tick on the left and the close with a tick on the right of a vertical line. It is compact and clean, and many systematic traders prefer it for that reason. The cost is that the open-to-close relationship is harder to see at a glance.
Candlesticks solve that with the colored body. The body makes the period's direction obvious from across the room, and the wicks make rejection visible without measuring anything. For reading price behavior quickly, the candlestick vs. bar charts comparison usually favors candlesticks.
The tradeoff is that the visual weight of a candle can make a single period feel more important than it is. A bar chart understates; a candlestick can overstate. Neither one adds information the other lacks.
How to read a single candle in context
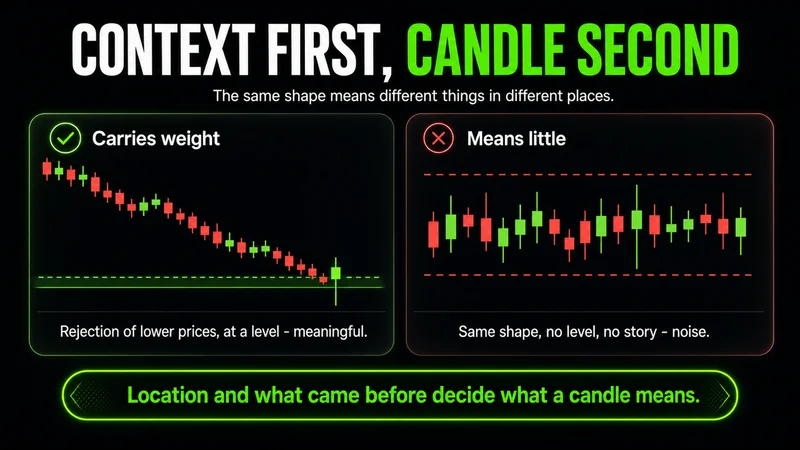
Reading a candle is reading context first and the candle second. The same shape means different things depending on where it forms and what came before it.
A long lower wick at the bottom of an extended decline is a rejection of lower prices, and it carries weight. The same long lower wick in the middle of a quiet range carries almost none. Position relative to prior structure changes the meaning entirely.
Work through it in order. First, identify the prior trend. Second, mark the level the candle is reacting to: a prior swing high, a prior low, or an area where price stalled before. Third, read the candle's body and wicks against that level. The candle is only interesting when it forms somewhere that already mattered.
This is the discipline most beginners skip. They learn pattern names and start hunting for shapes anywhere on the chart. A hammer means little until you know it printed at a level price had already respected.
The patterns worth knowing, and the ones beginners overweight
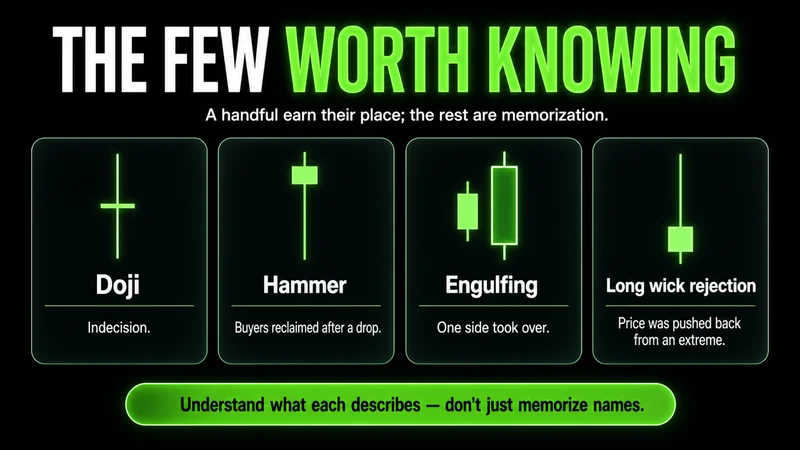
There are dozens of named candlestick patterns. A beginner needs a handful, and most of the value comes from understanding what each one is actually describing rather than memorizing the name.
The patterns that earn their place describe a shift in control:
- Doji — open and close are nearly equal, leaving a tiny body. It marks indecision, a pause where neither side won the period.
- Hammer — small body with a long lower wick, formed after a decline. It shows lower prices were rejected within the period.
- Shooting star — small body with a long upper wick, formed after an advance. It shows higher prices were rejected.
- Bullish engulfing — a green body that fully covers the prior red body, signaling buyers took control after sellers had it.
- Bearish engulfing — the reverse, where a red body swallows the prior green one.
That is enough to start. Notice that each one is a description of who won the fight, not a prediction. A candlesticks pattern is evidence, not a guarantee.
The trap is overweighting them. Beginners treat a hammer as a buy button. It is not. It is one input, and on its own it has a coin-flip's worth of edge. The edge comes from where it forms and what confirms it.
How to confirm a candlestick before risking capital
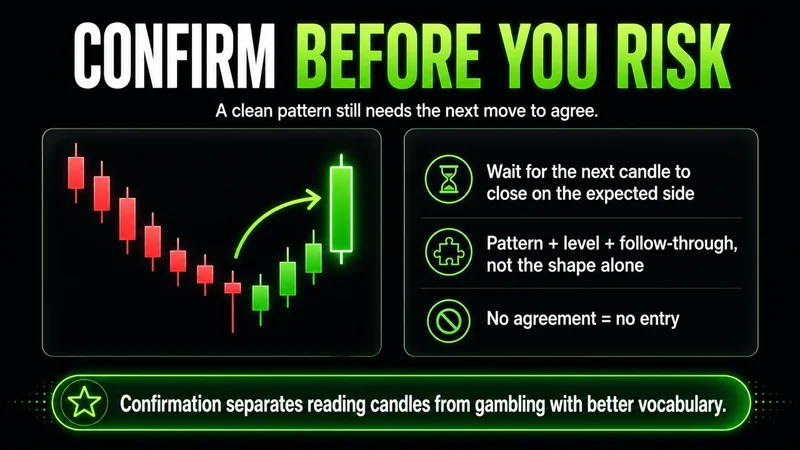
Confirmation is the step that separates reading candlesticks from gambling with better vocabulary. A pattern that looks clean still needs the next move to agree with it before it means anything for an entry.
For a reversal candle, confirmation is follow-through in the new direction. A hammer at support is a hypothesis; the next candle trading and closing above the hammer's high is the market agreeing with it. Without that follow-through, the rejection failed to attract continuation, and the setup is weaker than it looked.
Three things raise the quality of a confirmation:
- Follow-through — the next candle trades and closes in the expected direction.
- Participation — the move carries volume, so real capital committed to it rather than a thin drift.
- Level alignment — the candle is reacting to a level that already mattered, not floating in the middle of a range.
Here is the part that protects the account. Confirmation also defines your invalidation. If a hammer's low is the point where the idea is wrong, that low is where the risk sits. A candle you cannot build a defined invalidation around is a candle you cannot trade with control.
The reaction after price reaches a level matters more than the candle that forms at it. Confirmation is the market agreeing with your read, and until it does, you are guessing.
When candlesticks mislead you
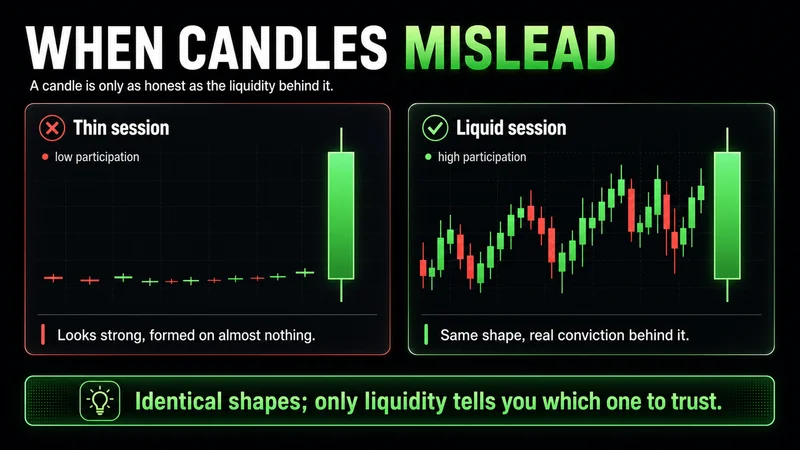
This is the section the beginner guides skip, and it is the most important one. Candlesticks are only as honest as the liquidity behind them.
In a thin overnight session, a single large candle can form on almost no participation. The shape looks identical to a high-conviction move in cash hours, but it means almost nothing. A few resting orders get filled, the print stretches, and the candle lies about how much real demand or supply was there. The same hammer that is meaningful at the open is close to random at 3 a.m. on light volume.
Gaps break candle reading in a related way. When price gaps from one period to the next, the open-to-close relationship inside a single candle no longer captures the move that mattered, because the decisive jump happened between candles, not within one. Reading the candle alone hides the gap entirely.
Volatility expansion is the third trap. A market can trade cleanly off candle structure for hours and then tear through the entire sequence within minutes when a macro catalyst hits. I see it most in gold, where the chart reads technically right up until a headline expands the range, and then the levels that looked reliable stop holding. The candle did not fail. The conditions changed underneath it.
The traps share a single fix:
- Thin sessions — check that the candle formed on real participation, not a handful of overnight fills.
- Gaps — read the move between candles, not just within one, when price jumps the open.
- Volatility expansion — treat clean structure as provisional once a macro catalyst is in play.
The lesson is to read liquidity and session context before you trust the shape. A candle is a measurement of a fight. If almost no one showed up to the fight, the measurement is empty.
Choosing a timeframe and building a simple checklist
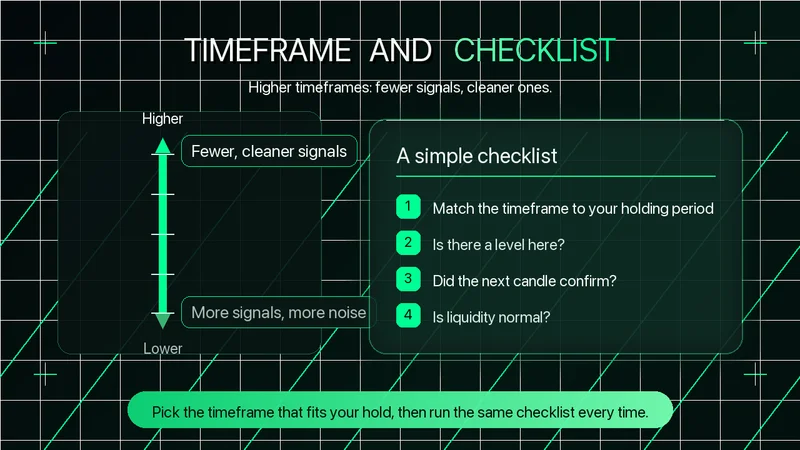
The best timeframe for candlesticks analysis is the one that matches how long you intend to hold and how much noise you can filter. There is no universal answer, but there is a usable principle: higher timeframes produce fewer, cleaner signals, and lower timeframes produce more signals with more noise.
A daily candle aggregates a full session into one print, so its rejection and follow-through carry real weight. A one-minute candle reflects seconds of order flow and is far easier to misread. Beginners usually start too low, drown in noise, and conclude that candlesticks do not work. The candles were fine; the timeframe was wrong for the experience level.
A short checklist keeps the reading honest. Before any candle changes a decision, run it:
- What is the prior trend, and is this candle with it or against it?
- Is the candle reacting to a level that already mattered?
- What do the body and wicks say about who won the period?
- Is there confirmation, or am I anticipating it?
- Where is the invalidation, and what does that risk cost?
- Is the session liquid enough for this candle to be trustworthy?
The checklist is the difference between reading price and reacting to it. Most beginners can name the patterns fine; what breaks down is running the same steps every time, under pressure, when a candle looks tempting. The checklist is where that consistency becomes a habit.
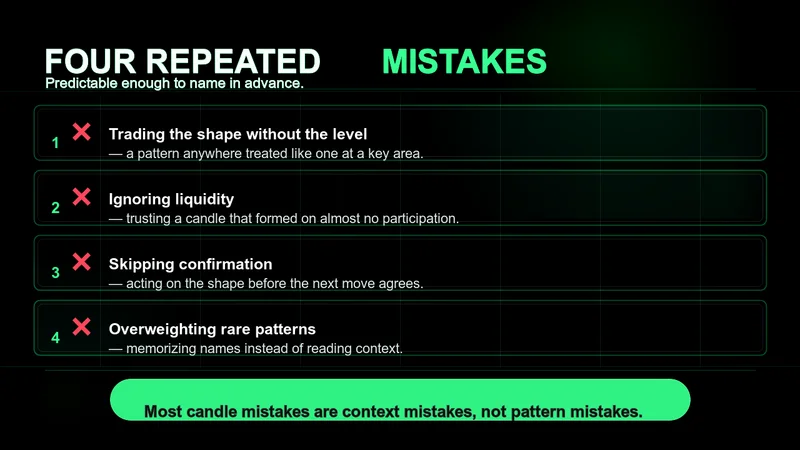
Common candlesticks mistakes beginners make
The failures repeat across almost every new trader, and they are predictable enough to name in advance.
Four failures repeat across almost every new trader:
- Trading the shape without the level — a pattern anywhere gets treated like a pattern at a key area, and the results are random.
- Entering before confirmation — turning a hypothesis into a position, then hoping the market agrees.
- Ignoring session and liquidity — trusting a candle that formed on no real participation.
- No defined invalidation — entering without a clear point where the idea is wrong.
The fourth is the quiet one. A candle entry without a clear invalidation is an entry without risk control, and that is how small mistakes compound into large losses. Read the candle, find the level, wait for confirmation, define the risk. Skip any step and the rest stops protecting you.
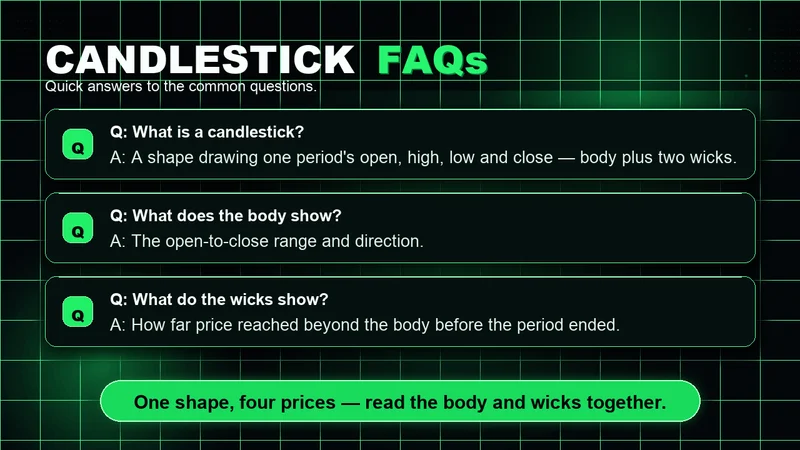
FAQs
What is candlesticks in trading? Candlesticks are a chart format that draws each time period as a body and two wicks, encoding the open, high, low, and close in one shape. The body shows the open-to-close range and direction; the wicks show how far price reached beyond that range before the period ended.
How do you read candlesticks for beginners? Read context before the candle. Identify the prior trend, mark the level the candle is reacting to, then read the body and wicks against that level. A long wick is a rejection, a long body is conviction, and a small body is indecision. The same shape means different things in different places.
What is the difference between candlesticks and bar charts? Both contain identical open, high, low, and close data. Bar charts render it with side ticks on a vertical line, while candlesticks use a colored body and wicks that make direction and rejection faster to read. Candlesticks read quicker; bar charts are more compact and understate single periods.
How do you confirm candlesticks before entering a trade? Wait for follow-through in the expected direction, ideally on solid participation, at a level that already mattered. The confirming move also defines your invalidation, so you enter with a clear point where the idea is wrong. Without confirmation, a clean-looking candle is still only a hypothesis.
What is the best timeframe for candlesticks analysis? The one matching your intended hold time. Higher timeframes like the daily produce fewer, cleaner signals; lower timeframes produce more signals with more noise. Beginners usually start too low and misread the noise, so a higher timeframe is the more forgiving place to learn.
How does reading candlesticks affect trading risk? Candle reading sets your invalidation, and invalidation is where risk is defined. A candle whose low or high marks a clear point where the idea is wrong gives you a measurable risk per trade. A candle you cannot build invalidation around cannot be traded with control, which is why context and confirmation matter before size does.
Worth the read?


