
Horizontal Analysis — Reading Financial Trends Over Time
Horizontal analysis compares financial statement line items across periods to reveal direction and pace of change, not just a single point-in-time value.
Horizontal analysis is the practice of comparing the same financial statement line item across two or more reporting periods to measure its dollar change and percentage change over time. It turns a static balance sheet or income statement into a record of direction: revenue is accelerating or stalling, costs are creeping or holding, debt is building or unwinding. The number on any single statement tells you where a company stands. Horizontal analysis tells you where it is going, and that is usually the more useful question.
Most people treat the technique as a definition to memorize. It is closer to a reading skill. The math is trivial. The judgment about which trends are real and which are noise is where the work actually lives.
What horizontal analysis means in plain terms
The horizontal analysis meaning is straightforward once you anchor it to a base period. You pick a starting year, then express every later period as a change from that base. The comparison runs left to right across columns of the same statement, which is where the word horizontal comes from. Vertical analysis runs down a single period; horizontal analysis runs across several.
The goal is not the percentage itself. The goal is the pattern the percentages form. A single 12% revenue increase means little in isolation. Three consecutive years of slowing revenue growth alongside rising interest expense means something specific, and it is the kind of thing a single-period snapshot will never show you.
The horizontal analysis formula
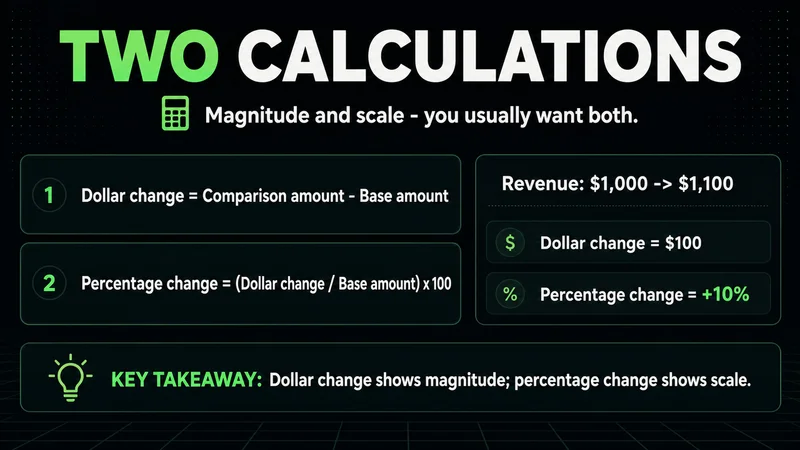
There are two calculations, and you usually want both. The dollar change shows magnitude. The percentage change shows scale relative to where the line item started.
- Dollar change = comparison period amount minus base period amount.
- Percentage change = dollar change divided by the base period amount, expressed as a percent.
A line that moves from 400 to 460 has a dollar change of 60 and a percentage change of 15%. The two figures answer different questions. A 15% jump on a small expense line is often irrelevant; the same 15% on revenue or total debt is not. Always read the percentage and the absolute number together, because either one alone can mislead.
A worked horizontal analysis example
A horizontal analysis example makes the components concrete. Take a simplified income statement comparing a base year to the following year, with each line carrying its dollar and percentage change.
| Line item | Base year | Next year | Dollar change | Percent change |
|---|---|---|---|---|
| Revenue | 1,000 | 1,150 | 150 | 15.0% |
| Cost of goods sold | 600 | 720 | 120 | 20.0% |
| Gross profit | 400 | 430 | 30 | 7.5% |
| Operating expenses | 250 | 260 | 10 | 4.0% |
| Net income | 150 | 170 | 20 | 13.3% |
Revenue grew 15%, which reads as a healthy year. The interpretation changes when you look across the row. Cost of goods sold grew 20%, faster than revenue, so gross profit only advanced 7.5%. The company sold more and kept less of each dollar. That divergence is the entire point of horizontal analysis. You would never see it by staring at net income alone.
How to read horizontal analysis without fooling yourself
Horizontal analysis interpretation comes down to separating direction from noise. A few habits keep the read honest.
- Compare growth rates against each other, not just against zero. Costs outpacing revenue is the signal, not the fact that both rose.
- Watch the base period. A percentage change off a tiny or unusual base year can look dramatic and mean nothing.
- Extend the window. Two periods give you a slope with no context. Three or more show whether a trend is forming or reverting.
- Tie the statements together. Rising receivables next to flat revenue is a different story than rising receivables next to rising revenue.
The technique describes what already happened. It does not forecast. Reading it as a prediction is the most common mistake, and it is the same mistake traders make when they treat a clean past trend as a guarantee of the next move. A series of expanding quarters tells you the direction held; it tells you nothing about whether the next quarter confirms or breaks it.
What to look for in horizontal analysis red flags
The components that matter most are usually the ones a company would prefer you skim past. Common horizontal analysis red flags show up as percentage swings that do not reconcile with the rest of the statement.
- Revenue growth that depends on a single quarter or a one-time item rather than steady delivery.
- Costs rising faster than revenue for more than one period, which compresses margin quietly before it shows up in net income.
- Receivables or inventory growing well ahead of sales, which can mean revenue is being recognized faster than cash is arriving.
- Debt expanding while operating cash flow stays flat, a combination that often precedes trouble well before it becomes obvious.
None of these are conclusions on their own. They are questions worth asking. The value of the analysis is that it points you toward the right questions instead of leaving you with a single reassuring number.
Horizontal analysis vs vertical analysis
Horizontal analysis vs vertical analysis is less a rivalry than a division of labor. Horizontal analysis measures change across time for one line item. Vertical analysis measures composition within one period by expressing each line as a percentage of a base figure, such as every income statement item as a percentage of revenue.
Used together they answer two different questions. Vertical analysis tells you what the company looks like right now: how much of every revenue dollar becomes profit. Horizontal analysis tells you how that picture is shifting period over period. A margin that is healthy today but eroding across three years is a different investment case than one that is thin but improving, and you need both lenses to see it.
A practical horizontal analysis checklist
This horizontal analysis checklist keeps the process disciplined rather than reactive.
- Choose a representative base period, not an outlier year.
- Calculate both the dollar change and the percentage change for each line.
- Compare related line items against each other, not in isolation.
- Extend to three or more periods before trusting a trend.
- Cross-check the income statement against the balance sheet and cash flow.
- Flag any percentage swing that does not reconcile with the rest of the statement.
The routine matters more than any single output. Consistency is what separates an analysis you can act on from a number you happened to like.
FAQs
What is horizontal analysis in simple terms? It is the comparison of the same financial statement line item across two or more periods, measuring how much it changed in dollars and in percent. It shows the direction and pace of change rather than a single point-in-time value.
What is the horizontal analysis formula? The dollar change equals the comparison period amount minus the base period amount. The percentage change equals that dollar change divided by the base period amount, expressed as a percent.
How is horizontal analysis different from vertical analysis? Horizontal analysis runs across time, measuring how one line item changes period over period. Vertical analysis runs within a single period, expressing each line as a percentage of a base figure such as total revenue.
What are common horizontal analysis red flags? Costs growing faster than revenue, receivables or inventory outpacing sales, and rising debt against flat operating cash flow. Each is a question to investigate, not a verdict on its own.
Can horizontal analysis predict future performance? No. It describes trends that already happened. A clean past trend can break in the next period, so the technique is best read as direction and context, not forecast.
Worth the read?


