Economic Indicators — How Traders Actually Read the Data
Economic indicators measure slices of the economy. The deviation from expectations moves price, not the headline number. Here is how traders read them.
An economic indicator is a published statistic about the economy — output, prices, jobs, sentiment — that traders and investors read to judge where conditions stand and where they may be heading. The meaning is simple. The hard part is what most explainers skip: the number itself rarely moves price. The gap between the number and what the market already expected is what moves price, and that gap is where most readers get the data wrong.
Economic indicators are not a crystal ball. They are a structured way to measure one slice of the economy over a set period, and no single release tells you much on its own. The professionals who use this data well treat it as context, not as a signal to act on directly. That distinction is the whole article.
What economic indicators mean and why the meaning gets blurred
The textbook definition is clean. An economic indicator is a measurement — gross domestic product, the unemployment rate, the Consumer Price Index, retail sales, manufacturing surveys — that describes the state or direction of an economy. Governments use these readings to set policy. Companies use them to plan. Investors use them to position.
Where the meaning blurs is in usage. People say "the data was strong, so the market should rise," as if the relationship were mechanical. It is not. A release lands against a forecast that is already built into prices. When the actual figure matches the consensus, the information was already absorbed, and price often barely reacts. When it deviates, the size and direction of the surprise drives the move, not the headline number.
So the working definition for anyone who trades around this data is narrower than the dictionary version. An economic indicator is a scheduled measurement whose deviation from expectations reprices risk. Hold that idea and the rest of the framework falls into place.
How economic indicators are classified by timing
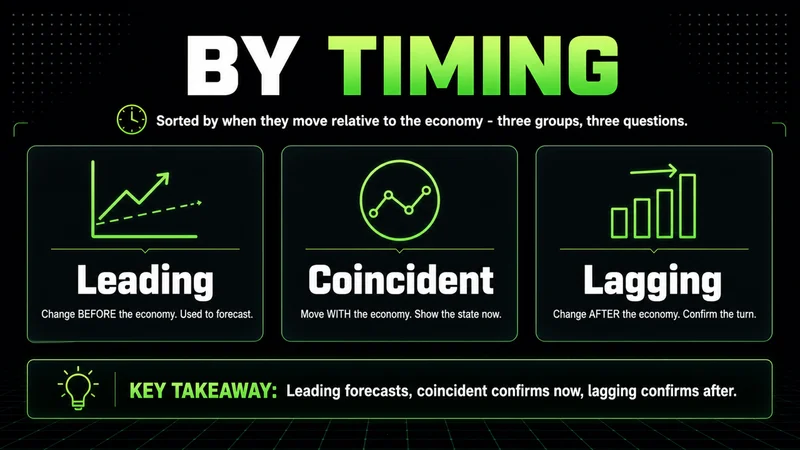
The most common classification sorts indicators by when they move relative to the broader economy. There are three groups, and they answer three different questions.
- Leading indicators change before the economy changes. They are used for short-term expectations, not confirmation. Building permits, new orders for manufactured goods, jobless claims, consumer confidence, and the equity market itself all tend to turn ahead of the cycle.
- Lagging indicators change after the economy has already moved. They confirm a trend rather than predict one. The unemployment rate, the Consumer Price Index, and corporate profits usually settle into their direction once the shift is underway.
- Coincident indicators move with the economy in real time. Industrial production, retail sales, and nonfarm payrolls describe the present rather than the future or the past.
A practical example makes the timing concrete. Jobless claims are a leading indicator, and they often start drifting higher weeks before the unemployment rate moves at all. The unemployment rate is lagging; it confirms a labor-market shift after the fact. If you wait for the unemployment rate to roll over before you accept that conditions are softening, the leading data has already told the story and the market has already begun to reprice it. Stock prices themselves are treated as a leading indicator for the same reason — they move on expectations about earnings and policy, not on the economy as it stands today.
The reason this matters for a trader is sequencing. A leading indicator that weakens while a lagging indicator still reads strong is not a contradiction. It is the normal shape of a turning point. Reading the two as if they should agree is one of the most common mistakes when reading economic indicators, and it leads people to dismiss early warnings because the confirming data has not caught up yet. Coincident indicators sit in between and are the most honest about the present: nonfarm payrolls, industrial production, and retail sales describe where the economy is right now, which is useful precisely because it carries no prediction baked in.
How economic indicators are classified by direction
A second classification sorts indicators by how they move relative to the cycle.
- Procyclical indicators rise when the economy expands and fall when it contracts. GDP and industrial production are the clear examples.
- Countercyclical indicators move the opposite way. Unemployment climbs as growth slows and falls as it recovers.
- Acyclical indicators show no reliable relationship to the cycle at all, which is a useful warning against forcing a pattern onto data that does not carry one.
Direction matters because it tells you how to read a surprise. A countercyclical indicator coming in "better than expected" can mean the economy is deteriorating. Reading the headline tone instead of the directional relationship is how a reader ends up positioned backward on the data.
How economic indicators are calculated and reported
Most headline indicators are calculated by government statistical agencies and central banks from survey samples and administrative records, then released on a fixed schedule. A few releases carry most of the weight in any given month:
- Gross domestic product, estimated and then revised twice as fuller source data arrives.
- The Consumer Price Index, built by the Bureau of Labor Statistics from a basket of goods and services priced across regions.
- Nonfarm payrolls and the unemployment rate, drawn from separate establishment and household surveys.
- The purchasing managers' indexes, survey-based diffusion readings on manufacturing and services activity.
GDP is estimated, then revised, which is why the first GDP print rarely settles the question on its own.
Two features of how the data is reported matter more than the calculation method.
First, the release comes with a consensus forecast attached. The economic indicators report that traders watch is really three numbers: the prior reading, the expected reading, and the actual. The market has already priced the expectation. Only the third number is new information.
Second, the first print is provisional. Payrolls and GDP in particular get revised, sometimes heavily, in later releases. A figure that drove a sharp move on release day can be quietly walked back a month later, after the position that reacted to it is long closed.
There is also the question of how an indicator is constructed, because the method shapes how much weight the number deserves. Survey-based readings, such as the manufacturing and services purchasing managers' indexes, are diffusion measures: they report the share of respondents seeing improvement rather than a dollar value, so a reading above 50 means expansion and below 50 means contraction. The CPI is a weighted basket, which means a single volatile component such as energy can swing the headline while the underlying trend, captured by the core reading that strips out food and energy, barely moves. Knowing whether you are looking at a survey, a basket, or a hard count tells you how much to trust the first decimal place. The market often reacts to the headline and then re-prices a few minutes later once participants parse the components — which is one more reason the immediate reaction is unreliable.
How economic indicators affect stocks and other markets
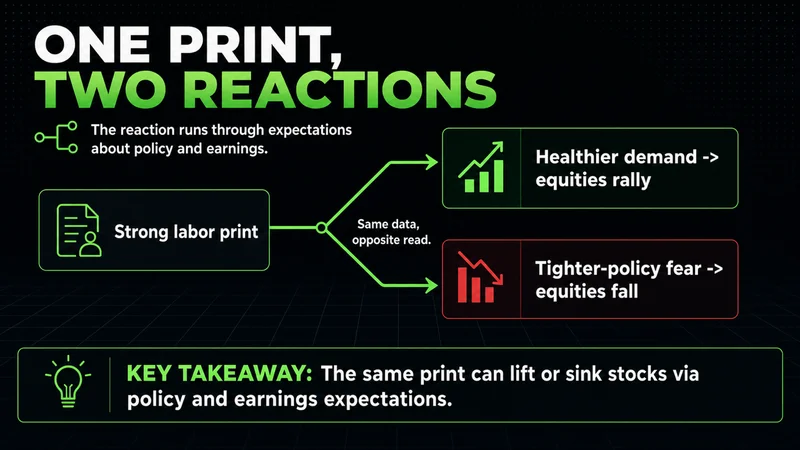
The transmission from a data release to stock prices runs through expectations about policy and earnings. A strong labor print can lift equities because it implies healthier consumer demand. The same print can sink equities if the market reads it as pressure for tighter monetary policy. The indicator did not change; the interpretation did, because the dominant concern shifted from growth to rates.
This is why the impact of economic indicators on stocks is conditional rather than fixed. The market decides, session by session, which variable it cares about most. In one regime, every inflation print is the only thing that matters. In another, the same release barely registers because attention has moved to growth or earnings. A reader who memorizes "high CPI means stocks fall" will be right often enough to feel confident and wrong exactly when it costs the most.
Bonds, currencies, and futures absorb the same data faster and more directly than individual equities. Index futures reprice within seconds of a major release, which is precisely why the first reaction is rarely the clean one. Treasury yields move first on inflation and rate-sensitive data because the data feeds directly into expectations for the policy rate. The dollar follows the same rate logic. Equities then react to where yields settle, which is why a stock-market move on a data day is often a second-order response to the bond market rather than a direct read of the indicator itself. A trader watching only the equity index can miss that the real decision was already made one market over.
How traders use economic indicators data in practice
Here is the part the textbook taxonomy leaves out. A discretionary futures trader does not treat a data release as a buy or sell button. The release is a scheduled volatility event, and the work happens around it, not on the print itself.
Before the release, the calendar tells you a high-impact number is due, and that alone changes behavior. The pre-release adjustments are mechanical and require no forecast:
- Position size comes down ahead of the print.
- Open risk gets reduced or hedged rather than left fully exposed.
- Stops get reviewed, because thinning liquidity can run them at prices that would never trade in a normal tape.
Liquidity thins ahead of the print as participants step back, which means the spread widens and stops sit in dangerous places. None of this requires a forecast. It requires respecting that the next few minutes are unusually hostile to clean execution.
The first move after major news is often not the cleanest opportunity. Many traders lose money reacting emotionally to the volatility spike instead of waiting for structure to develop.
After the release, the question is not "what did the number say" but "how did price behave around the level it mattered." Did the initial spike hold, or did it get reclaimed within minutes? Acceptance above or below a key level after the data tells you more than the data itself. The indicator sets the stage; price action confirms or rejects the reaction. This is the same observation-then-confirmation process that applies to any high-volatility environment — the economic release is simply the catalyst.
So the honest answer to how traders use economic indicators is that the data shapes context and risk posture far more than it generates direct entries. It tells you when to be smaller, when to wait, and which level the market is likely to defend or abandon. That is a more useful role than a prediction engine, and a more realistic one.
Economic indicators versus broader fundamental analysis
Economic indicators are one input into fundamental analysis, not a synonym for it. Fundamental analysis of a company examines earnings, margins, balance sheet strength, and competitive position — the specific health of one business. Economic indicators sit a level above that, describing the macro environment every company operates inside.
The two connect at the seams. A consumer-facing company's earnings depend on the same consumer spending that retail sales and confidence surveys measure. A bank's results track interest rates, which track inflation data. So macro indicators set the backdrop, and company fundamentals fill in the picture for an individual name. Treating macro data as the whole of fundamental analysis is a category error; treating it as irrelevant to a single stock is the opposite one.
For someone trading index futures rather than single names, the distinction collapses somewhat. The index is the economy in aggregate, so the macro release is closer to a direct input. For a stock picker, the indicator is the weather and the company is the trip — you check the weather, but it does not tell you whether to take the trip.
When economic indicators stop working as signals
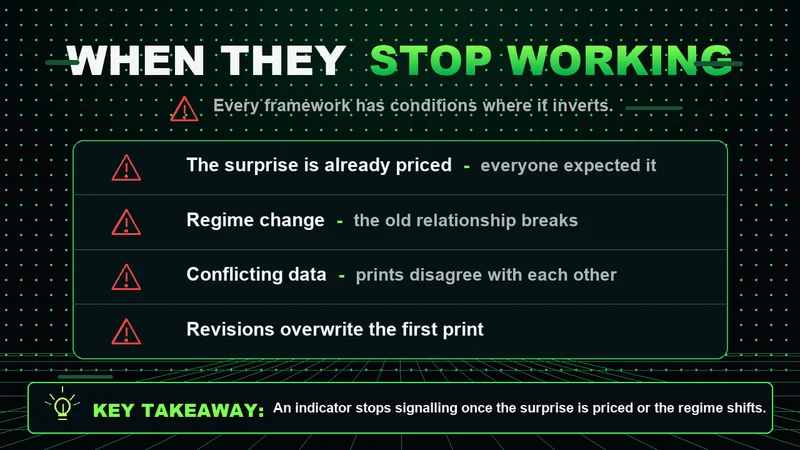
Every framework has conditions where it inverts, and this one has several. Naming them is more useful than another list of indicators.
Indicators stop working when the surprise is already priced. If the whole market expects a weak print and gets one, the weak number can trigger a rally because the bad news was absorbed days ago and the remaining flow is positioning relief. The data confirmed the fear, and confirmed fear is often a reason to buy.
They stop working when the print gets revised. A reaction built on a first-release figure that later moves substantially was a reaction to noise. The revision rarely gets the same attention as the original, so the false signal lingers in people's mental models longer than it should.
They stop working in thin liquidity. The textbook reaction assumes a deep, two-sided market digesting the number. Overnight, on a holiday, or in the first seconds after release, that depth is absent. The same data can produce a violent move that fully reverses once real liquidity returns. Structure that reads cleanly in regular cash hours can mean almost nothing on a thin tape.
And they stop working when the market's dominant concern shifts. The relationship between any single indicator and price is regime-dependent. A framework that assumes inflation data drives everything inverts the moment attention rotates to growth or earnings. No indicator carries a fixed meaning across all conditions.
This is the limitation the cleaner explainers omit. Economic indicators are genuinely useful as context, and genuinely unreliable as standalone signals. Holding both ideas at once is the difference between using the data and being used by it.
What to take from this
Economic indicators measure slices of the economy, sort into leading, lagging, and coincident groups by timing, and into procyclical, countercyclical, and acyclical groups by direction. That taxonomy is worth knowing. But the practical meaning is narrower: an indicator is a scheduled measurement whose deviation from expectations reprices risk, and whose first print is provisional, regime-dependent, and quietly revised later.
For a trader, the data is context and a volatility schedule, not a set of entry signals. It tells you when to reduce risk, when to wait for structure, and which level the market is likely to defend. Read it that way — as one input into a process built on risk and confirmation — and it earns its place. Read it as a prediction, and it will eventually hand you a confident, well-reasoned, losing position.
Worth the read?