
Vertical Analysis — Reading Statements as Percentages
Vertical analysis expresses each financial statement line as a percentage of a base figure, revealing structure, composition, and red flags across periods.

Vertical analysis is a method of reading a financial statement where every line item is expressed as a percentage of a single base figure from that same statement. On the income statement the base is total revenue. On the balance sheet the base is total assets. The result is a common-size statement that strips out the dollar size of a company and shows its structure instead, which is what makes two businesses of very different scale directly comparable.
Most people treat this as an accounting chore. The useful version treats it as a way to see where a company actually spends its revenue and how its capital is arranged, period after period, without the absolute numbers getting in the way.
What vertical analysis means in practice
The meaning is narrower than the name suggests. You take one statement, pick the base, and divide every other line by that base. Nothing crosses between periods and nothing crosses between statements. That single-column focus is the whole point: it answers one question well, which is how the parts of this statement relate to the whole right now.
A common-size income statement tells you that cost of goods sold is 62% of revenue and operating expense is 21%. A common-size balance sheet tells you that inventory is 18% of total assets and long-term debt is 35%. Those percentages are the language vertical analysis speaks, and they hold their meaning whether the company books 4 million or 4 billion in revenue.
The vertical analysis formula and its components
The formula is deliberately simple.
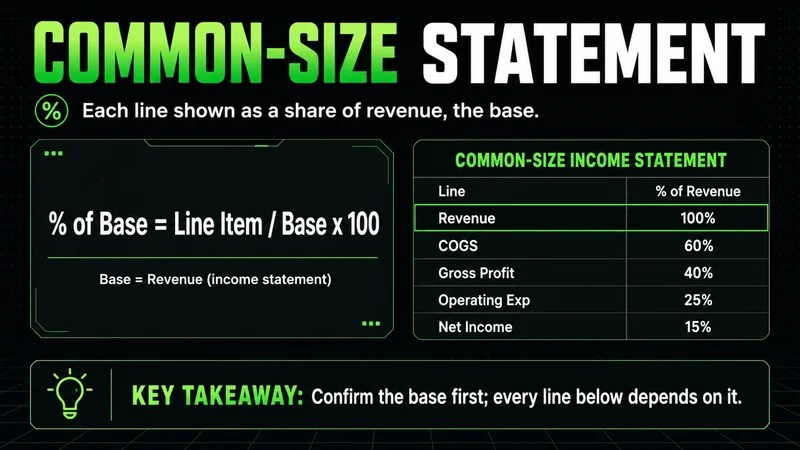
Line item percentage = (line item / base figure) × 100
The components that matter are the choice of base and the consistency of it. For the income statement, every line divides by total revenue. For the balance sheet, every asset line divides by total assets, and every liability and equity line divides by total liabilities plus equity, which equals total assets. Get the base wrong and the whole column stops being comparable.
A worked example makes the components concrete. Suppose a company reports the following income statement for one year:
| Line item | Amount | Percent of revenue |
|---|---|---|
| Revenue | 500,000 | 100% |
| Cost of goods sold | 310,000 | 62% |
| Gross profit | 190,000 | 38% |
| Operating expenses | 105,000 | 21% |
| Operating income | 85,000 | 17% |
| Net income | 64,000 | 12.8% |
Every percentage in the right column came from dividing the amount by the 500,000 revenue base. The same routine applies to the balance sheet, only the base changes to total assets.
How to read vertical analysis step by step
Reading a common-size statement is a sequence, not a glance.
- Confirm the base. Revenue for the income statement, total assets for the balance sheet. If the base is unusual, every percentage below it is suspect.
- Read top to bottom and note where revenue goes. Cost of goods sold, then operating expense, then what survives to net income.
- Compare the structure to a prior period or a peer. A single column is a snapshot; the meaning shows up against a reference.
- Flag the lines that moved more than the rest. A two-point shift in gross margin is a bigger signal than a fractional move in a small line.
- Ask why before you conclude. A percentage tells you what changed, not the cause.
The interpretation lives in the comparison. On its own, 62% cost of goods sold is just a number. Set against last year's 58%, it says margin is compressing, and that is the part worth investigating.
Vertical analysis vs horizontal analysis
The two methods answer different questions, and the confusion between them is common.
| Aspect | Vertical analysis | Horizontal analysis |
|---|---|---|
| Direction | Down one statement, one period | Across periods, same line |
| Base | A figure within the statement | The earliest period's value |
| Shows | Structure and composition | Growth and trend |
| Best for | Comparing different-size companies | Tracking change over time |
Vertical analysis reads down a single column and shows composition. Horizontal analysis reads across columns and shows the rate of change. They are complements, not substitutes. The structure from one and the trend from the other together tell you more than either alone, which is why most thorough reviews run both.
What vertical analysis red flags look like
The percentages are most useful when they expose something the dollar figures hide. A few patterns deserve attention.
Watch gross margin and operating margin over several periods. Steady compression in either, even by a point or two a year, usually means pricing power or cost control is slipping. Watch a single expense line that climbs faster than revenue as a share of the total; it is absorbing more of every sale than it used to. On the balance sheet, watch inventory and receivables rising as a percentage of total assets while revenue stays flat, which can signal slow-moving stock or collection problems.
None of these are conclusions by themselves. They are places to point the next question.
Where common-size percentages mislead
Vertical analysis breaks down precisely where traders and analysts most want it to hold. A percentage is only as honest as its base, and the base can move underneath you. If revenue is shrinking, expense lines can look stable or even improve as a percentage while the underlying business deteriorates, because both the line and the base are falling together. The common-size column reads clean while the company contracts.
The same problem appears with one-off items. A single large asset sale, an impairment, or a tax settlement distorts that period's percentages and makes the structure look like something it is not. Vertical analysis assumes the base figure is representative; in a period with an unusual event, it is not, and the percentages quietly mislead. This is the discipline the method demands. The percentage tells you the composition, never the cause, and treating composition as a verdict is where the analysis goes wrong.
A short checklist for vertical analysis
A practical pass over a common-size statement comes down to a few repeatable steps.
- Confirm the base figure and that every line uses it consistently.
- Build the percentages for the income statement and the balance sheet separately.
- Compare each column against a prior period and at least one peer.
- Mark the lines that shifted more than the rest and the direction they moved.
- Check whether a one-off item or a shrinking base is distorting the column before drawing any conclusion.
Run that sequence and the percentages do their job, which is to surface the questions worth asking, not to answer them.
Related reading
Vertical analysis is one lens among several for reading a company's statements. Horizontal analysis covers change over time, common-size statements formalize the percentage view across both statements, and ratio analysis turns selected line relationships into standardized measures. Each adds a dimension the others leave out, and the structure that vertical analysis exposes is usually the first place to start.
Worth the read?


