
Kondratieff Analysis — What It Means for Investors
Kondratieff analysis maps the economy onto a 40-to-60-year wave of four seasons. Read it as multi-decade regime context, not a market-timing tool.
Kondratieff analysis is the study of long economic waves that run roughly 40 to 60 years, where technology, credit, and prices move through four repeating seasons of growth and decline. It is a framework for understanding where the broad economy sits in a multi-decade cycle, not a tool for timing next week's trade. That distinction is where most people misuse it.
The theory came from Nikolai Kondratieff, a Russian economist who in the 1920s noticed that capitalist economies seemed to cycle over generations rather than years. Joseph Schumpeter later named these long waves after him. The idea is elegant, the historical fit is suggestive, and the practical edge is far smaller than its fans claim. All three of those things are true at once, and a serious reader has to hold them together.
What is Kondratieff analysis in plain terms
Kondratieff analysis maps the economy onto a long wave with four phases, often labeled as seasons. Spring is recovery and inflationary growth after a long decline. Summer is mature expansion that starts to strain under rising prices and inefficiency. Autumn is a deflationary plateau where a few sectors still run hot while the broad base weakens. Winter is contraction, debt unwinding, and falling prices, which clears the ground for the next spring.
The kondratieff analysis meaning that matters for an investor is simple. Each wave is driven by a cluster of innovation, from steam and railroads to electricity and autos to information technology. Early in a wave, productivity and profits rise, and asset prices tend to follow. Late in a wave, the productivity gains are already priced in, debt has built up, and the market becomes more fragile. That is the entire claim in one paragraph.
Everything else is detail layered on top of that skeleton.
How the four phases actually behave
The seasons are useful because they describe a sequence, not a calendar. You do not get a Kondratieff winter on a fixed date. You get conditions that rhyme with winter, and the value is in recognizing the regime, not the timestamp.
A working summary of the phases:
- Spring: rising growth, low but firming inflation, expanding credit, broadening asset participation.
- Summer: strong growth giving way to overheating, rising inflation, tightening policy, narrowing leadership.
- Autumn: disinflation or outright deflation in parts of the economy, a speculative plateau where a few names carry the index, growing complacency.
- Winter: contraction, deleveraging, falling prices, defaults, and the slow repair that sets up the next cycle.
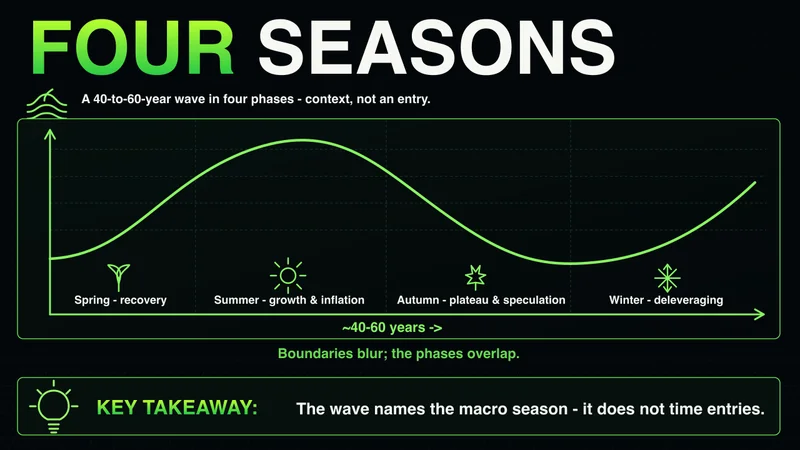
Read those four lines again and notice how loose the boundaries are. Autumn and winter blur. Spring can stall and retest. The framework gives you a vocabulary for the macro backdrop, and that is a real contribution. It does not give you an entry.
A kondratieff analysis example using technology waves
The cleanest kondratieff analysis example is the wave built on a general-purpose technology. Take information technology from the early 1980s forward. The early decades brought rising productivity, a long bull market in equities, and a credit expansion that funded the buildout. By the framework, that maps to a spring and summer phase. The dot-com collapse, the 2008 credit crisis, and the long period of low rates that followed can be read, loosely, as the strains of a maturing wave working themselves out.
Here is the honest part of the example. You can fit that story to the data after the fact with very little effort. The same decades can be sliced to support a different phase count entirely. A pattern you can only label in hindsight is a description, not a forecast, and an investor needs to treat it that way.
How Kondratieff analysis affects stock prices
The kondratieff analysis stock market effect is indirect. The wave does not set price. Liquidity, positioning, earnings, and policy set price. What the wave offers is a prior on the broad environment, which then shapes how those nearer-term forces tend to resolve.
In a spring or early-summer regime, breadth is wide, drawdowns recover, and momentum strategies tend to be rewarded because the underlying trend supports them. In a late-autumn regime, leadership narrows, valuations stretch, and the same momentum that worked for years becomes more dangerous because it is running on fewer and fewer names. The kondratieff analysis market impact, then, is a shift in the base rates you are operating under, not a signal you can act on directly.
That is the most you should claim. Anyone telling you the K-wave says to buy or sell on a specific date is selling certainty the framework cannot deliver.
How traders actually use Kondratieff analysis
Most of the competing explainers stop at the theory. The harder question is how a working trader uses kondratieff analysis for investors without fooling themselves, and the answer is narrow on purpose.
You use it as regime context that sits behind your normal process. It does not replace market structure, liquidity reads, or risk management. It informs them. If the long-wave backdrop reads late-cycle, you hold positions on a shorter leash, you respect that breadth is thin, and you treat the tape's strength with more suspicion than you would in a young expansion. None of that is a trade by itself. It is a thumb on the scale of decisions you were already making for structural reasons.
The best traders react well; they do not predict perfectly. A multi-decade cycle is the opposite of a precise prediction, so the only responsible use is reactive. You let the wave tell you which base rates apply, then you wait for structure and confirmation to give you the actual entry.
Here is where this doesn't work. The framework is built for cash-driven, credit-cycle economies on a generational horizon. In a single trading session, or even a single quarter, the K-wave is silent. It tells you nothing about whether the next breakout holds. Lean on it for intraday or swing decisions and you are using a calendar built for decades to time something measured in hours, which is how people talk themselves into bad positions with a sophisticated-sounding excuse.
A practical kondratieff analysis checklist
If you want to use the wave responsibly, turn it into a short checklist for market analysis and stop there:
- Identify the dominant innovation cluster driving the current economy, and ask whether its productivity gains are early or already priced in.
- Read the credit backdrop. Expanding credit supports spring and summer behavior; deleveraging signals autumn and winter.
- Check breadth and leadership. Wide participation fits early phases; a narrow index carried by a few names fits a late plateau.
- Note inflation's direction, since firming prices map to spring and summer while disinflation or deflation maps to autumn and winter.
- Translate the result into base rates only. Decide whether you hold positions longer or shorter, not whether you enter today.
Notice that the checklist never outputs a buy or a sell. It outputs context. That is the correct ceiling for a tool operating on this horizon.
Kondratieff analysis vs business cycle analysis
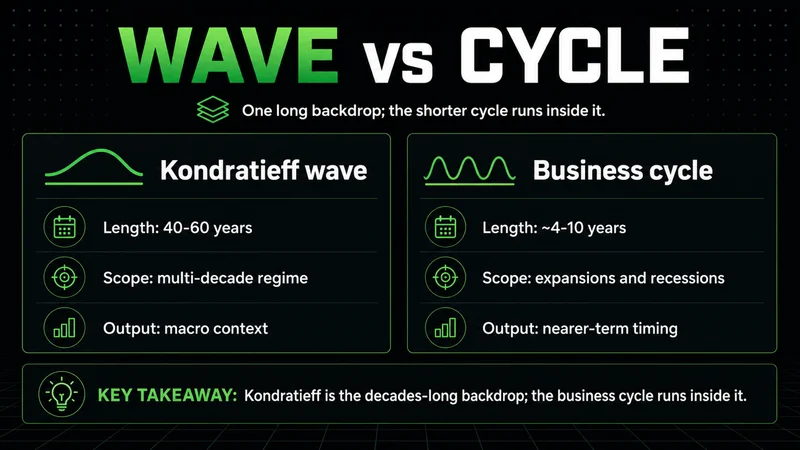
The kondratieff analysis vs business cycle analysis comparison is the one most people get backward. They are not competitors. They operate on different clocks.
The ordinary business cycle runs in years. It tracks expansion, peak, contraction, and trough, and it is what central banks respond to with rate decisions you can actually trade around. The Kondratieff wave runs in generations and is meant to explain the larger backdrop those shorter cycles play out against. You can have several full business cycles inside a single Kondratieff season.
For a practitioner, the business cycle is the one with usable resolution. It moves on a horizon where positioning, policy, and earnings respond in a timeframe you can manage. The long wave sits behind it as slow context. Treating the K-wave as if it had business-cycle precision is the core error, and it is why so much of the writing on this topic overpromises.
The limitations and criticism every investor should weigh
The kondratieff analysis limitations are serious, and honesty about them is what separates useful study from wishful thinking.
The main objections:
- The dataset is thin. A 50-year cycle gives you only a handful of complete waves in the entire era of reliable economic records, which is far too few to validate statistically.
- The phase boundaries are subjective. Different analysts date the same turning points years apart, which means the framework can be fit to almost any narrative.
- The drivers are contested. Even supporters disagree on what causes the waves and when they begin and end.
- Mainstream academic economics largely does not accept the long wave as a tested theory.
These are not reasons to discard the framework. They are reasons to size your conviction in it accordingly. A model you cannot test rigorously and cannot date precisely is a lens, not a signal. Use it to widen your understanding of regime, and never to justify a position that your structure and risk rules would otherwise reject. Context earns its place in a decision, but context borrowed from a fifty-year cycle is still only context, and it can never carry an entry on its own.
FAQs
What is kondratieff analysis in one sentence? It is the study of long economic waves of roughly 40 to 60 years, broken into four seasonal phases, used to understand the multi-decade regime the economy is operating in rather than to time individual trades.
How does kondratieff analysis work in the stock market? It works indirectly. The wave shapes the broad backdrop of growth, credit, and inflation, which changes the base rates for breadth and risk, and that backdrop then influences how nearer-term forces like liquidity and earnings tend to resolve into price.
What is the difference between kondratieff analysis and business cycle analysis? The business cycle runs in years and has tradable resolution, while the Kondratieff wave runs in generations and serves as slow context. Several full business cycles can fit inside one Kondratieff season.
What are the main limitations of kondratieff analysis? The historical dataset is too thin to validate statistically, the phase boundaries are subjective and disputed, the causes are contested even among supporters, and mainstream economics largely does not accept the theory as tested.
Can kondratieff analysis time market entries? No. The framework operates on a decades-long horizon and says nothing about whether a given breakout holds. The responsible use is as regime context behind your normal structure and risk process, never as a direct buy or sell signal.
Related reading
If this framework is useful to you, the next step is to study the shorter cycles that sit inside it. Read up on the ordinary business cycle and how policy responds to it, on market structure and how to read breadth and leadership, and on risk management, since regime context only earns its keep when it feeds disciplined position sizing. The long wave is the backdrop. The work that protects capital happens on the shorter clocks.
Worth the read?


