
Law of Demand — What It Means and How Markets Use It
The law of demand says quantity rises as price falls and falls as price rises. Here is how that inverse rule plays out in real markets.

The law of demand says that when the price of a good rises, the quantity buyers want falls, and when the price drops, the quantity they want rises. Everything else is held constant. That inverse relationship between price and quantity is the whole rule, and it is one of the most reliable starting points in economics. It is also where most people stop, which is a problem if you trade.
A demand curve drawn on a chalkboard behaves perfectly. A live market does not. Price and demand still pull against each other most of the time, but the order book adds pressure, emotion, and positioning that a textbook diagram leaves out. Understanding the law of demand is useful. Understanding where it bends is what separates reading a market from reciting a definition.
What is the law of demand in simple terms
Strip away the jargon and the law of demand is a statement about behavior. People buy less of something as it gets more expensive, and more of it as it gets cheaper, assuming nothing else about their situation changes. Economists call that last part ceteris paribus, which just means holding income, preferences, and the price of substitutes steady so you can isolate the effect of price alone.
The relationship is inverse, and it is usually drawn as a line sloping down from the upper left to the lower right. Price sits on the vertical axis. Quantity demanded sits on the horizontal axis. As you move down the price axis, the quantity people are willing to buy moves out along the horizontal axis. That single downward slope is the visual shorthand for the entire rule.
Two reasons sit underneath it. The first is the substitution effect: when one product gets pricier, buyers switch to cheaper alternatives that do a similar job. The second is the income effect: a higher price means a fixed budget buys less, so the real purchasing power of each buyer shrinks. Both push in the same direction, and together they give the curve its shape.
A law of demand example you already understand
You do not need a trading account to see the law of demand in your day. You see it every time a store cuts a price.
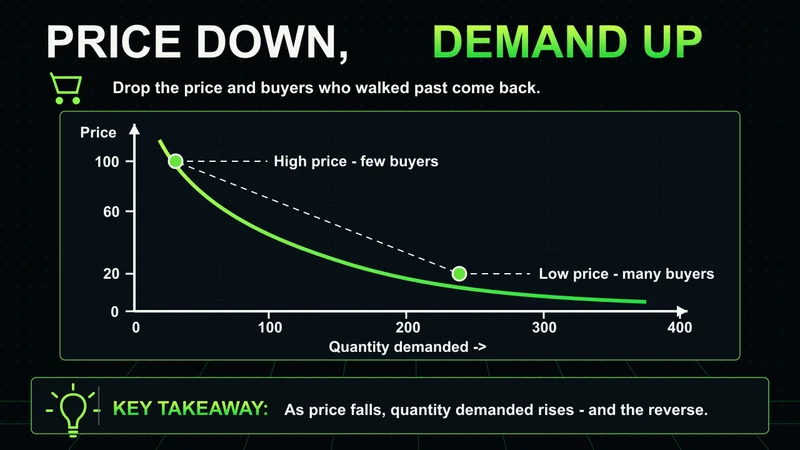
Consider a grocer selling apples at one dollar each. Demand sits at a steady level. The grocer runs a sale and drops the price to fifty cents. More people buy, including shoppers who would have walked past at the original price. Quantity demanded rises because price fell. Now reverse it. A dealership raises truck prices to widen its margins, and fewer buyers commit at the higher number. Quantity demanded falls because price rose.
The same logic scales from a fruit stand to a global exchange. What changes is not the principle. What changes is how many other forces are acting on price at the same time, and how fast they move.
How the law of demand works in the stock market
Markets are the law of demand running in real time, with the price updating every fraction of a second. A stock has a finite float of shares. Buyers and sellers meet in the order book, and price moves to the level where the quantity offered matches the quantity sought.
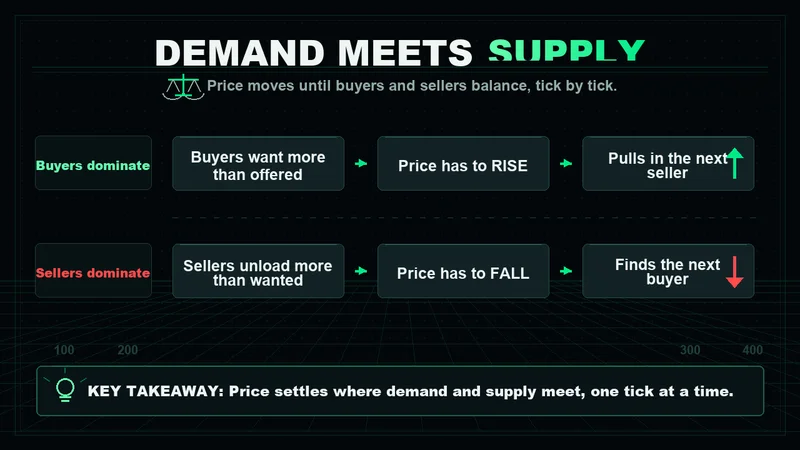
When buyers want more shares than sellers are offering, price has to rise to pull in the next willing seller. When sellers are unloading more than buyers want, price drops to find the next willing buyer. That is the law of demand and its mirror, the law of supply, settling against each other tick by tick. A company that posts strong earnings sees demand for its shares increase, and price climbs. Weak results soften demand, and price slides. The relationship between price and quantity is doing exactly what the textbook predicts, just faster and with money on the line.
This is where most retail explanations stop, and it is the point at which a trader has to keep going. Demand on a chart is not a smooth curve. It arrives in clusters, at specific levels, from participants of very different sizes. The single most important read is not whether demand exists, but where it sits and how it behaves when price reaches it.
Liquidity drives markets more than opinions do. A stock can have a bullish story and still get sold into every rally because large sellers are positioned at known levels, waiting. The demand has to absorb that supply before price can hold higher. Watching how price reacts when it reaches a level tells you more than any forecast about whether the next move has follow-through.
Why the law of demand matters for investors and traders
The law of demand is not a trading signal, and treating it as one is a mistake. It is a framework for understanding why price moves at all. That distinction matters.
For an investor, the practical value is in reading reactions. A few uses worth holding onto:
- Price discovery is a negotiation, not a verdict. Every level on the chart is a place where buyers and sellers disagreed enough to transact.
- Volume gives the curve weight. A price move on heavy participation reflects real demand or supply. The same move on thin volume is far easier to reverse.
- Cheaper is not automatically a buy. A falling price can attract demand, or it can signal that informed sellers know something the tape has not fully priced.
The edge is not in knowing that demand pushes price up. Everyone knows that. The edge is in reading whether demand is actually present and committed when price reaches a level you care about, or whether it is thin and likely to fail.
Law of demand vs law of supply
The two laws are halves of the same mechanism, and they always operate together. The law of demand describes buyer behavior: quantity demanded rises as price falls. The law of supply describes seller behavior in the opposite direction: quantity supplied rises as price rises, because higher prices make producing and selling more attractive.
Plot both and the demand curve slopes down while the supply curve slopes up. Where they cross is the equilibrium price, the level at which the quantity buyers want equals the quantity sellers offer. In a stock, that crossing point is simply the current trade price, and it moves continuously as new orders arrive.
Keeping the distinction clean helps you read order flow. A breakout is demand overwhelming the supply resting above price. A breakdown is supply overwhelming the demand resting below it. Same market, two forces, one price caught between them.
Limitations and exceptions to the law of demand
The law of demand holds most of the time, which is exactly why the exceptions are worth knowing. They are the conditions where the framework inverts.
- Giffen goods: inferior staples where a price increase can raise quantity demanded, because buyers can no longer afford pricier substitutes and lean harder on the cheap staple.
- Veblen goods: luxury items where a higher price signals status, so demand rises with price rather than falling.
- Expectations of further moves: if buyers believe a price will keep climbing, they buy more as it rises, chasing rather than retreating.
That last one is the trap that costs traders the most. In a strong momentum move, you will see quantity demanded increase as price increases, the exact opposite of the textbook curve. Buyers chase, fearing they will miss the move, and the demand curve effectively bends upward for a while. The same inversion runs in reverse during a panic, when falling prices trigger more selling instead of more buying.
This is where the law of demand stops being a reliable guide and becomes a liability if you lean on it blindly. The clean inverse relationship holds in orderly conditions. The moment fear or greed dominates and expectations take over from price, the relationship can flip, and a trader expecting cheaper prices to draw buyers can get run over by a market doing the opposite. Knowing that the rule has an off switch is more useful than knowing the rule.
A practical law of demand checklist for reading the market
You do not apply the law of demand by quoting it. You apply it by watching how price behaves when it reaches a level. A short checklist for that:
- Locate the level. Mark where demand or supply has shown up before. Prior reaction points are where the next negotiation tends to happen.
- Read the reaction, not the approach. How price behaves once it reaches the level matters more than how it got there.
- Confirm with participation. Look for volume and acceptance, not a single touch. Real demand absorbs supply and holds; thin demand gives way.
- Define invalidation first. Decide in advance what price action would prove the demand was not real, and treat that level as your exit.
- Respect the inversions. In strong momentum or panic, expect the relationship to bend. Do not assume cheaper draws buyers or expensive repels them.
The checklist is reactive by design. You are not predicting where demand should be. You are waiting for the market to show you where it actually is, then responding with defined risk.
The market does not reward you for knowing the definition. It rewards you for reading whether demand is real when price arrives, and for being wrong cheaply when it is not.
FAQs
What is the law of demand in simple terms? It is the rule that buyers want less of a good as its price rises and more of it as its price falls, assuming nothing else about their situation changes. The relationship between price and quantity is inverse, which is why the demand curve slopes downward.
What is a clear law of demand example? A store cuts the price of apples from one dollar to fifty cents and sells more of them, drawing in buyers who passed at the higher price. Raise the price instead, and quantity demanded falls. The same logic moves stock prices when buyers and sellers meet in the order book.
How does the law of demand affect stock prices? When demand for a stock exceeds the shares on offer, price rises to attract more sellers. When sellers outnumber buyers, price falls to find new demand. Earnings, news, and positioning shift demand constantly, and price adjusts to where buyers and sellers agree to transact.
What is the difference between the law of demand and the law of supply? The law of demand describes buyers, with quantity demanded rising as price falls. The law of supply describes sellers, with quantity supplied rising as price rises. Where the two curves cross is the equilibrium price, which in a stock is simply the current trade price.
What are the exceptions to the law of demand? Giffen goods, Veblen goods, and markets driven by expectations all break the rule. In a strong momentum move or a panic, buyers can chase rising prices or dump falling ones, inverting the normal inverse relationship between price and quantity.
Why does the law of demand matter for investors? It explains why price moves and gives you a framework for reading reactions at key levels. The value is not in knowing demand pushes price up, but in reading whether demand is actually present and committed when price reaches a level worth trading.
Worth the read?


