
Price Action — Reading What Price Actually Tells You
Price action is the study of how price moves on a chart. Learn to read context, confirmation, and defined risk before the entry, not the pattern alone.
Price action is the study of how price moves on a chart, with no indicators in the way. It is the raw record of every buy and sell decision, printed as candles. Most traders treat it as a pattern-spotting game. It is closer to reading intent: where participants committed, where they failed, where they got trapped.
That distinction matters more than any single setup. A pin bar at a random level is noise. The same pin bar where price already failed twice is information. Price action only becomes useful when you stop reading candles in isolation and start reading them in context.
Price action meaning, stripped to what matters
The price action meaning that survives contact with a live market is simple. Price is the only variable that pays you, and everything else is a derivative of it.
Remove the indicators and you are left with four pieces of data per candle: the open, the high, the low, and the close. From those, you read three things:
Where price tried to go and got rejected.
Where price accepted a level and held.
Where momentum expanded or stalled.
That is the entire alphabet. Patterns are just words built from those letters. A trader who understands rejection and acceptance does not need a name for every formation, while one who memorizes 40 patterns but cannot read context will still lose. The pattern was never the edge.
What is price action in trading versus indicator-based trading
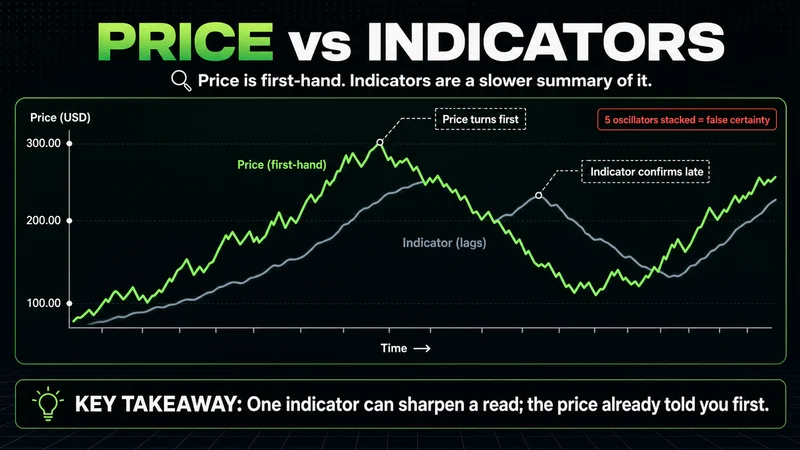
This is where price action vs indicators usually gets framed as a war. It is not. An indicator is a tool that summarizes price; it does not decide for you. A moving average is just a smoothed version of price you could read directly off the candles.
The real difference is latency and clutter. Indicators are derived from price, so they lag it. Price action is the first-hand data; indicators are the second-hand summary. When the two disagree, the trader running five overlapping oscillators usually freezes, because the tools cancel each other out.
The chart already told you everything. The indicators just told you again, slower.
None of this makes indicators useless. A volume profile or a single moving average for trend bias can sharpen a read. The failure mode is using them to manufacture certainty the market never offered.
How to identify price action on a chart
Reading price action on a chart starts with structure, not patterns. Before you label a single candle, mark the swing highs and swing lows. That sequence tells you whether the market is trending, ranging, or transitioning.
A price action chart example makes this concrete. Say the S&P 500 futures sweep the prior session high, then close back below it on the next candle. That is not a breakout. It is a failed attempt, and the rejection is the signal. The sweep took the liquidity resting above the high; the close back inside showed buyers could not hold what they took.
From there the read is mechanical:
Mark structure: higher highs and higher lows, or lower highs and lower lows.
Mark the levels where price previously reacted hard.
Wait for price to return to one of those levels.
Read the reaction candle by candle, not the level alone.
The level gives you the location. The reaction gives you the trade. Reverse that and you are guessing.
A price action trading strategy built on confirmation
A workable price action trading strategy is less about the entry pattern and more about price action confirmation. The pattern proposes; confirmation decides.
Confirmation is not a magic candle. It is the market doing what your thesis required before you commit capital. If your read is that a level will reject price, confirmation is the rejection actually printing: a wick through the level, a close back inside, and follow-through on the next candle. No follow-through, no trade.
This is also where most breakouts fail. Traders enter emotionally on the break instead of waiting for structure to confirm it held. The breakout candle looks decisive; the retest is where you learn whether anyone defended it.
A pre-entry price action checklist
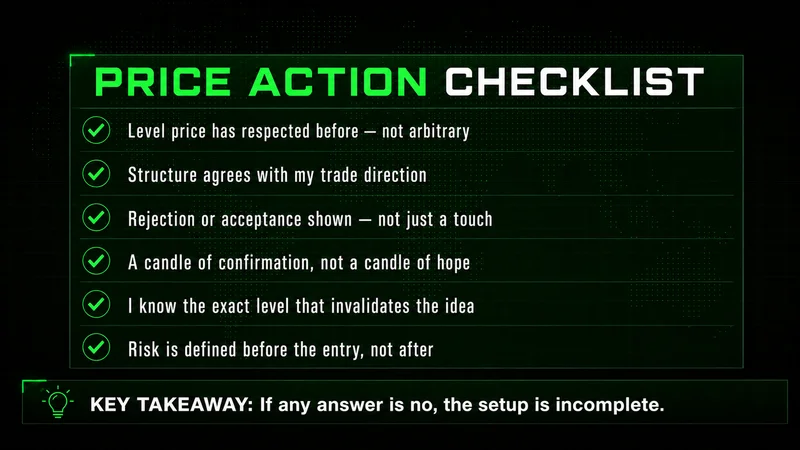
Run this price action checklist before risking a cent. If any answer is no, the setup is incomplete.
Is the level one that price has respected before, or is it arbitrary?
Does the structure agree with the direction I want to trade?
Has price shown rejection or acceptance, not just a touch?
Is there a candle of confirmation, not just a candle of hope?
Do I know the exact level that invalidates the idea?
Is my risk defined before the entry, not after?
The checklist is not there to find more trades. It removes the ones that only looked good because you wanted them to.
The best timeframe for price action analysis depends on context
There is no single best timeframe for price action analysis. The timeframe has to match the level you are trading and the volatility of the session.
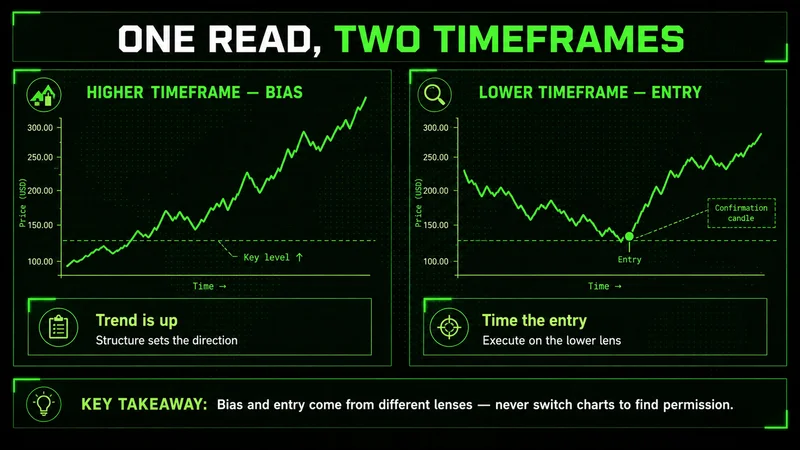
Lower timeframes show more detail and more noise. The five-minute chart prints rejections all day; most mean nothing. Higher timeframes filter noise but commit you to wider risk. A common approach reads structure on a higher timeframe and times the entry on a lower one, so bias and execution come from different lenses.
What does not work is switching timeframes after you are already in a losing trade to find a chart that agrees with you. That is not analysis. It is searching for permission.
When price action reads break down
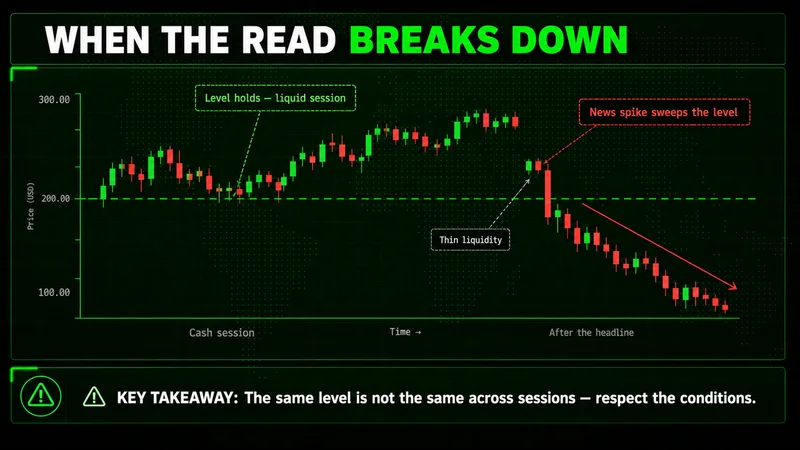
Price action is not a constant. It reads cleanly when there is real participation and enough liquidity to make reactions meaningful, and it degrades when those conditions disappear.
Structure that looks textbook in cash-session hours can mean almost nothing overnight on thin liquidity, where a handful of resting orders push price through levels that would have held during the day. The same is true around major news. The first move after a release is often the least reliable read on the chart, because volatility expands faster than structure can form. Gold respects structure for hours, then invalidates the entire move within minutes when a macro headline hits.
Knowing where price action stops working is part of using it. The trader who treats every level the same across sessions gets run over by the exception.
Common price action mistakes beginners make
Most price action mistakes are not analytical. They are discipline problems wearing an analysis costume.
The first is reading candles without context, which is gambling with better vocabulary; a doji means one thing inside a range and another at the edge of a trend. The second is entering on the pattern instead of the confirmation. The third is moving the invalidation level after the trade turns against you, which converts a small operational loss into a large emotional one.
The edge is the discipline to wait for context, confirmation, and defined risk to line up at one level, and to pass on everything else.
FAQs
What is price action in trading? It is the analysis of raw price movement on a chart, using the open, high, low, and close of each candle rather than indicators. The goal is to read where participants committed and failed, then trade the reaction at meaningful levels.
Is price action better than using indicators? Neither is automatically better. Price action is first-hand data and indicators are derived from it, so indicators lag. Many traders use one indicator for context and read the actual decisions off the price itself.
How do I confirm price action before entering a trade? Wait for the market to do what your thesis required: a clear rejection or acceptance at the level, a confirmation candle, and follow-through on the next candle. Without follow-through, the setup is incomplete.
What is the best timeframe for price action? There is no universal best timeframe. Match it to the level you are trading and the session volatility, often reading structure on a higher timeframe and timing the entry on a lower one.
Why do my price action setups keep failing? Usually the entry came from the pattern rather than confirmation, the level was arbitrary, or the conditions were poor. Thin liquidity and news-driven volatility break clean reads that would hold in normal sessions.
Price action rewards the trader who reads context before reaction and reaction before entry. Mark the structure, wait for confirmation at a level that matters, define the invalidation, and pass on everything else. Run the checklist, respect the conditions where the read breaks down, and the chart starts telling you something worth acting on.
Worth the read?


