
Market Anomaly — What It Is and Why It Fades
A market anomaly is a price pattern that beats the efficient market hypothesis. Here is what it means, real examples, and why the edge fades.

Market Anomaly — What It Is and Why It Fades
A market anomaly is a price pattern that produces returns the efficient market hypothesis says should not exist. It is a repeatable edge in the data: a stretch of time, a type of stock, or a calendar window where prices behave in a way that pure efficiency cannot explain. The catch is the part most explanations skip. By the time an anomaly is named, documented, and traded by everyone reading about it, most of the edge is already gone.
That is the honest version of the market anomaly meaning, and it is the one that matters if you actually trade. The textbook treats anomalies as proof that markets misprice. The screen treats them as opportunities that shrink the moment they are crowded. Both views are right. Holding them at the same time is the whole skill.
What a market anomaly actually means
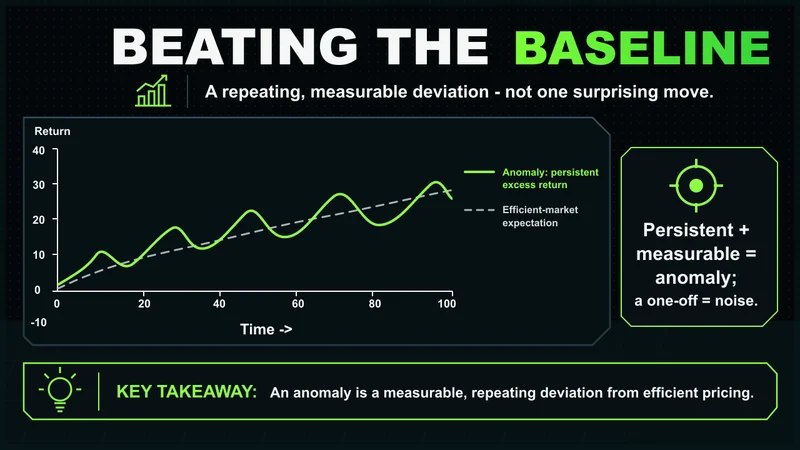
Strip away the academic framing and a market anomaly is simple. It is a deviation from random, efficient pricing that persists long enough and often enough to be measured. Not a single surprising move. A pattern.
The reference point is the efficient market hypothesis, which holds that prices already reflect available information, so no consistent edge should survive. An anomaly is the counterexample. When a clearly defined group of stocks beats the market on a schedule, or a calendar window delivers above-average returns year after year, efficiency has a hole in it.
Three things separate a real anomaly from noise:
- It is persistent. It shows up across many years, not one good run.
- It is measurable. You can define the rule precisely and test it on out-of-sample data.
- It is economically meaningful. The edge survives realistic trading costs, not just a frictionless backtest.
Most patterns that excite new traders fail the third test. They look real on a chart and disappear once you subtract commissions, spread, and slippage. That distinction is where the entire conversation about market anomalies lives.
Market anomaly vs efficient market hypothesis
The efficient market hypothesis comes in three strengths:
- Weak form — past prices cannot predict future prices.
- Semi-strong form — all public information is already priced in.
- Strong form — even private information is reflected in the price.
Anomalies attack the first two, and the semi-strong form takes the most damage.
If markets were perfectly efficient in the semi-strong sense, value stocks would not systematically outperform growth stocks over long horizons, and stocks that drifted up after an earnings surprise would not keep drifting. Both happen. The market anomaly vs efficient market hypothesis debate is not really about whether anomalies exist. It is about why.
There are two camps that try to explain why:
- The risk camp says anomalies are compensation for risk the simple models miss, so the extra return is earned, not free.
- The behavior camp says anomalies come from investor mistakes: people overreact, anchor, chase, and sell at the wrong time, and those errors leave footprints in prices.
In practice, both forces are usually present at once, which is exactly why no single model cleanly explains every case.
What a market anomaly looks like in the stock market
A market anomaly example is easier to trust than a definition. These are the patterns documented across decades of data:
- The size effect. Smaller companies have historically delivered higher average returns than large ones, beyond what their risk alone would predict.
- The value effect. Stocks trading cheap relative to book value or earnings have tended to outperform expensive growth names over long horizons.
- Momentum. Stocks that have risen over the past several months tend to keep rising in the near term, and recent losers tend to keep lagging.
- Post-earnings-announcement drift. After a strong earnings surprise, prices keep moving in the surprise's direction for weeks instead of repricing instantly.
- The January effect. Small-cap stocks have shown a tendency to rise early in the year, often tied to tax-driven selling the prior December.
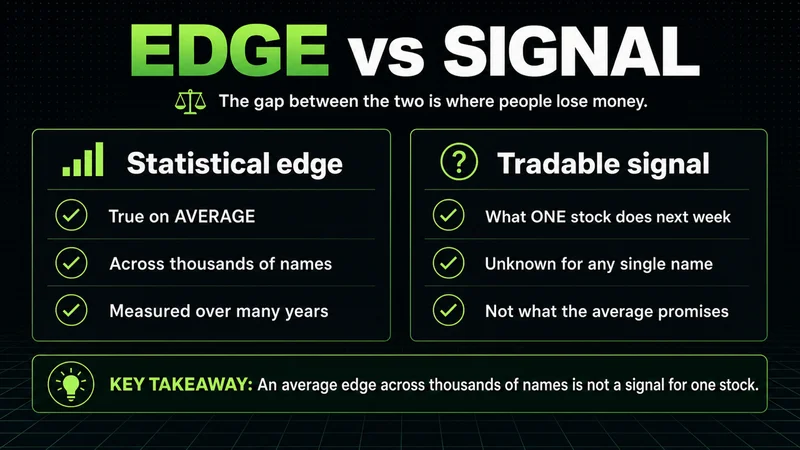
Notice that these are statements about averages across many names and many years. None of them tells you what a single stock does next week. That gap between a statistical edge and a tradable signal is where most people lose money trying to use anomalies.
How a market anomaly affects stock prices
A documented anomaly changes prices through the people trading it. When a pattern is obscure, the edge is wide because few are competing for it. As research spreads and capital floods in, the buying that exploits the anomaly pushes prices toward fair value sooner, and the edge compresses.
This is the part the standard explainers underweight. An anomaly is not a fixed feature of the market. It is a moving target that the act of trading erodes. The market anomaly market impact runs in one direction: attention shrinks the opportunity.
Liquidity drives this more than opinion does. A small-cap pattern can look powerful in a backtest and then collapse in practice because the stocks involved cannot absorb size without moving against you. The edge exists at one dollar of capital and vanishes at scale. That is not a flaw in the data. It is the reason the anomaly survived long enough to be found at all.
Why most traders never monetize a known anomaly
Here is the uncomfortable observation after years of watching edges come and go. A published anomaly is usually a worse trade than an unpublished one, and by the time a retail trader reads about it, three forces have already gone to work against it.
The first is cost. A pattern that returns a few percent a year on paper can be entirely consumed by spread, commissions, and slippage once you trade it at a realistic frequency.
The second is capacity. Many anomalies live in small, illiquid, or hard-to-borrow stocks. The professionals who could exploit them at scale often cannot, which is part of why the edge persists, and the retail trader who can fit inside that capacity rarely has the discipline to hold the position through the drawdowns the strategy requires.
The third is decay. Once an edge is in textbooks and screeners, more capital chases it and the return thins out. Some anomalies have measurably weakened in the years after publication.
There is a deeper point under all of this. Most traders do not have a strategy problem. They have a discipline problem. An anomaly is a long-horizon statistical tilt, and it pays only to those who can sit through the losing stretches without abandoning the rule at the worst moment. That requirement, not the pattern itself, is what filters the winners from the rest.
When the anomaly stops working
Every anomaly has a regime where it inverts, and ignoring that is how a sound edge becomes a slow bleed. Momentum is the clearest case. It compounds quietly for years and then suffers violent reversals at major turning points, when yesterday's leaders become the steepest losers in days. A trader sized for the calm periods gets carried out in the crash.
The value effect has gone through stretches lasting years where cheap stocks underperformed expensive ones badly enough to make people declare the anomaly dead. Calendar effects fade once they are widely known and front-run. The rule is consistent: an anomaly works until enough capital arrives to price it away or a regime shift turns the historical relationship on its head. Treat any edge as conditional, define what would prove it broken, and respect that line.
A practical checklist for a real market anomaly
Before you treat any pattern as tradable, run it through a market anomaly checklist. This is the filter that separates a persistent edge from a data-mined coincidence:
- Does it survive realistic costs? Subtract spread, commissions, and slippage at the frequency you would actually trade. If the edge dies, it was never an edge for you.
- Is it defined in advance? A real rule is specific and testable, not a pattern you noticed after the fact and fit to the data.
- Does it hold out of sample? Test it on time periods and markets you did not use to discover it.
- Is there an economic reason? Risk-based or behavioral, the best anomalies have a logical cause, not just a correlation.
- Can you size it without moving the market? An edge you cannot trade at your capital level is academic.
- Have you defined invalidation? Know in advance the conditions under which you would conclude the edge has decayed and stop.
If a pattern fails even one of these, treat it as noise until proven otherwise. Capital preservation comes before chasing a return that may not exist after costs.
FAQs
What is a market anomaly in simple terms? It is a price pattern that earns returns the efficient market hypothesis says should not be possible. It shows up repeatedly in the data, across a type of stock, a calendar window, or a market condition, in a way pure efficiency cannot explain.
What is the difference between a market anomaly and the efficient market hypothesis? The efficient market hypothesis says prices already reflect available information, so no consistent edge should survive. A market anomaly is the documented exception, a pattern that delivers abnormal returns and forces the question of whether it is hidden risk or investor behavior.
What is a common market anomaly example? The value effect, where cheaper stocks tend to outperform expensive ones over long horizons, and momentum, where recent winners keep winning in the near term. The size effect, the January effect, and post-earnings-announcement drift are also widely documented.
Why does a market anomaly matter for investors? It shows that markets are not perfectly efficient, which means disciplined, rules-based strategies can sometimes tilt the odds. It also warns that any edge is conditional and tends to weaken once it is widely known.
Do market anomalies eventually disappear? Many weaken after they are published, because more capital chases the same edge and prices adjust sooner. Some persist for structural reasons tied to risk or liquidity, but no anomaly should be assumed permanent.
Related reading
If you want to go deeper on the ideas behind market anomalies, the most useful next steps are the efficient market hypothesis itself, the role of behavioral finance in pricing, and how transaction costs and liquidity shape what is actually tradable. Each one explains a different reason an edge appears, persists, or fades, and together they turn a list of patterns into something you can reason about with discipline rather than chase.
Worth the read?


