
Profitability Ratios — How to Read Them Like an Analyst
Profitability ratios show how much profit a company keeps per dollar earned or invested. Here is how to calculate and read them like an analyst.

Profitability ratios measure how much profit a company keeps from each dollar it earns, owns, or has invested in it. They turn an income statement and balance sheet into a few comparable numbers: margins that track how much revenue survives after costs, and returns that track how hard the company's assets and equity are working. Read alone, a single ratio tells you almost nothing. Read in context, the same numbers separate a durable business from one that looks healthy for a quarter and then doesn't.
Most beginners treat these ratios as a scoreboard. Higher is better, lower is worse, done. That framing is where the analysis usually goes wrong. A 40% gross margin means one thing for a software company and something very different for a grocery chain. The number only becomes information once you fix the context around it.
What profitability ratios actually measure
There are two families. Both come straight off the financial statements, so the profitability ratios meaning is concrete, not abstract.
- Margin ratios measure profit as a share of revenue. They answer: of every dollar of sales, how much is left after a given layer of cost?
- Return ratios measure profit against the capital used to produce it. They answer: how much profit does the company generate per dollar of assets or shareholder equity?
Margins tell you about pricing power and cost control. Returns tell you about capital efficiency. A company can run strong margins and weak returns if it ties up enormous capital, and the reverse happens too. You need both views to see the business clearly.
The core profitability ratios formula set
Five ratios cover most of what an investor needs. Each profitability ratios formula uses figures you can pull directly from the income statement or balance sheet.
- Gross profit margin = (Revenue − Cost of goods sold) ÷ Revenue. This isolates production and pricing before overhead.
- Operating profit margin = Operating income ÷ Revenue. This adds the cost of running the business — overhead, sales, administration — but stops before interest and taxes.
- Net profit margin = Net income ÷ Revenue. This is the bottom line after every cost, including interest and taxes. It is the most complete margin and the most exposed to one-time items.
- Return on assets (ROA) = Net income ÷ Total assets. This shows how efficiently the asset base produces profit.
- Return on equity (ROE) = Net income ÷ Shareholders' equity. This shows the return generated on the owners' stake.
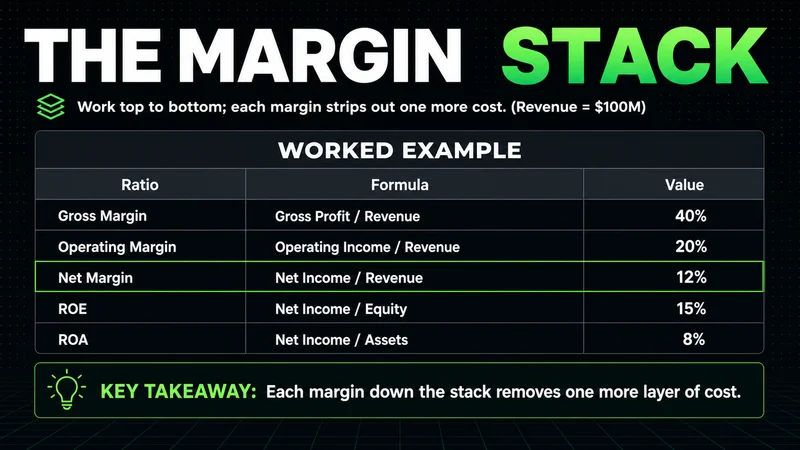
Notice the layering in the three margins. Each one strips away another tier of cost, so reading them in sequence shows you exactly where profit leaks. A healthy gross margin paired with a thin operating margin points at bloated overhead, not a pricing problem.
How to calculate profitability ratios from a real statement
The profitability ratios calculation is straightforward arithmetic once you have located the inputs. Work top to bottom on the income statement, then cross to the balance sheet for the return ratios.
Here is a worked profitability ratios example. Suppose a company reports the following for the year:
| Line item | Amount |
|---|---|
| Revenue | 1,000 |
| Cost of goods sold | 600 |
| Operating income | 180 |
| Net income | 120 |
| Total assets | 800 |
| Shareholders' equity | 500 |
From those figures:
- Gross profit margin = (1,000 − 600) ÷ 1,000 = 40%.
- Operating profit margin = 180 ÷ 1,000 = 18%.
- Net profit margin = 120 ÷ 1,000 = 12%.
- ROA = 120 ÷ 800 = 15%.
- ROE = 120 ÷ 500 = 24%.
The arithmetic takes a minute. The judgment takes longer, because a 12% net margin is strong in retail and unremarkable in software. The number is the easy part.
How investors use profitability ratios in practice
A single year of ratios is a snapshot. The signal lives in comparison. Practitioners read these numbers along three axes at once.
- Against the company's own history. Five years of margins shows the trend. A net margin sliding from 14% to 9% while revenue grows is a warning that growth is being bought with discounts or rising costs.
- Against direct competitors. Margins only mean something inside an industry. Compare a company to its closest peers, not to the market as a whole.
- Against the cost of capital. An ROE below what investors could earn elsewhere is not really a return — it is capital that would work harder somewhere else.
This is where profitability ratios interpretation separates from calculation. The number answers what; the comparison answers whether it matters. I treat any single ratio as a question, not an answer. It tells me where to look next, not what to conclude.
What is a good profitability ratio?
There is no universal threshold, and anyone who quotes one is selling certainty the data doesn't support. A good profitability ratios benchmark is always relative. The right reference is the industry median plus the company's own trend.
That said, a few rules of thumb hold across most sectors:
- A net margin that is consistently positive and stable beats one that is high but volatile.
- An ROE driven mostly by genuine operating profit is healthier than one inflated by heavy debt.
- A widening gap between gross margin and net margin, year over year, almost always rewards a closer look.
The useful question is never "is this number high?" It is "is this number high for this industry, and is it improving or decaying?"
Profitability ratios vs valuation ratios
These two families answer different questions, and confusing them is a common beginner error. Profitability ratios measure how well the business operates. Valuation ratios — price-to-earnings, price-to-book, EV/EBITDA — measure how the market prices that operation.
A company can be highly profitable and badly overpriced. It can be mediocre on margins and a bargain on price. Profitability tells you about the business; valuation tells you about the deal. The profitability ratios vs valuation ratios distinction matters because a strong margin does not make a stock cheap, and a low multiple does not make a weak business good. You read profitability first to judge quality, then valuation to judge price.
Where profitability ratios break down
Ratios are summaries, and summaries hide things. This is the part most explainers skip. Profitability ratios limitations are real, and they show up exactly when you most want a clean answer.
- Accounting choices distort them. Depreciation methods, inventory accounting, and revenue recognition all move the inputs without changing the underlying business. Two identical companies can report different margins purely from accounting policy.
- One-time items break the trend. A single asset sale or write-down can swing net margin and ROA for a year. A ratio built on a distorted year carries the distortion forward.
- Debt flatters ROE. A company can lift return on equity by adding debt rather than improving operations. The ratio rises while the risk rises faster.
The sharpest failure is comparing across industries. Profitability ratios read cleanly within a sector where the business models rhyme; pulled across sectors, the same numbers mean almost nothing. A capital-light advertising platform and a capital-heavy airline cannot be ranked on ROA alone, and treating that comparison as meaningful is how analysis turns into guessing with better vocabulary. Use the ratios where the context holds, and hold them loosely where it doesn't.
FAQs
What is profitability ratios in simple terms? Profitability ratios are numbers that show how much profit a company keeps relative to its sales, its assets, or the money invested in it. They convert raw financial statements into a few figures you can compare across years and against competitors.
How do you calculate profitability ratios? Pull the inputs from the income statement and balance sheet, then divide. Margins divide a profit figure by revenue; returns divide net income by total assets or by shareholders' equity. The math is simple division, then expressed as a percentage.
What does profitability ratios tell investors? They tell investors how efficiently a company turns revenue and capital into profit. Read over several years and against peers, they signal whether a business has durable pricing power, disciplined costs, and capital that is working hard enough to justify the investment.
What is a good profitability ratios figure? There is no single good number. A figure is strong only relative to the company's industry median and its own multiyear trend. A stable, peer-beating margin matters more than a high number in one isolated year.
What are the most common profitability ratios mistakes beginners make? Comparing companies across unrelated industries, trusting a single year of data, and ignoring how debt inflates return on equity. Each one produces a confident conclusion from numbers that don't actually support it.
How do profitability ratios differ from valuation ratios? Profitability ratios measure how well the business operates. Valuation ratios measure how the market prices that business. One judges quality; the other judges price. You need both, and you read them in that order.
Worth the read?


