
Return on Equity — What ROE Really Tells Investors
Return on equity shows how much profit a company earns per dollar of shareholder equity, and where the number quietly misleads investors who read it alone.
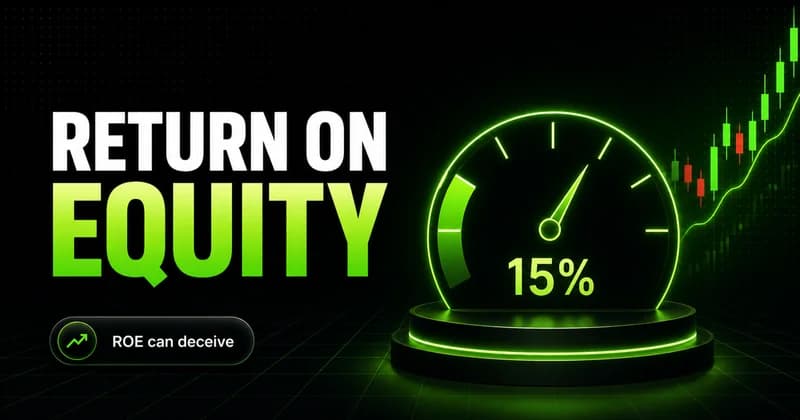
Return on equity measures how much profit a company produces for every dollar of shareholder equity it holds. It is net income divided by shareholders' equity, expressed as a percentage. A 15% return on equity means the business earned 15 cents on each dollar shareholders left in the company. That single number says a lot about how efficiently management turns invested capital into earnings, and almost nothing about whether the stock is worth owning today.
That gap is where most people misread the metric. They treat a high reading as a verdict instead of a question. Return on equity is a starting point for analysis, not the end of it. The number tells you the company is generating returns on its equity base; it does not tell you why, whether the figure is durable, or what the market already paid for it.
What return on equity actually measures
Return on equity answers a narrow question: how productive is the capital that belongs to shareholders? Shareholders' equity is what remains after you subtract a company's total liabilities from its total assets. It is the owners' stake. When a business earns net income on that stake, return on equity tells you the rate of that return.
The return on equity meaning becomes clearer with a comparison. Two companies each earn $10 million in net income. One does it on $50 million of equity; the other needs $200 million. The first runs a 20% return on equity, the second 5%. Same profit, very different efficiency. The first company is squeezing four times the earnings out of each dollar of owner capital.
That efficiency is what long-term investors care about. A business that compounds capital at a high rate, and can reinvest at that rate, builds shareholder value faster than one that needs ever-larger amounts of equity to produce the same profit. Return on equity is the cleanest single read on that capability.
The return on equity formula and how to calculate it
The return on equity formula is straightforward:
Return on Equity = Net Income / Shareholders' Equity
Net income is the bottom line of the income statement, the profit left after all costs, interest, and taxes. Shareholders' equity sits on the balance sheet as total assets minus total liabilities. Divide the first by the second, multiply by 100, and you have the percentage.
The return on equity calculation has one detail worth getting right. Equity changes over the year as the company retains earnings, issues shares, or buys them back. Using the year-end figure alone can distort the result. The more accurate approach uses average shareholders' equity, the beginning balance plus the ending balance divided by two. That smooths out a large buyback or capital raise that lands late in the period.
The sequence to calculate return on equity is short:
- Pull net income from the income statement for the period.
- Pull beginning and ending shareholders' equity from two consecutive balance sheets.
- Average those two equity figures.
- Divide net income by average equity and multiply by 100.
Use trailing twelve-month net income against average equity when you want a current read, and full fiscal-year figures when you are comparing across years. Mixing a quarterly profit with an annual equity base is the most common arithmetic error, and it produces a number that looks precise and means nothing.
A worked return on equity example
Consider a return on equity example. A company reports $40 million in net income for the year. Its shareholders' equity was $180 million at the start of the year and $220 million at the end. Average equity is $200 million. Divide $40 million by $200 million and you get 0.20, or a 20% return on equity.
Now change one input. Suppose the same $40 million in profit sat on $400 million of equity. The return on equity drops to 10%. The company is twice as profitable in absolute dollars as a smaller rival earning $20 million, yet half as efficient with owner capital as the 20% version of itself. The dollar figure flatters; the ratio corrects.
This is why the calculation matters more than the headline. A rising net income with a faster-rising equity base can produce a falling return on equity, and that decline is a signal the dollar profit alone would hide.
What counts as a good return on equity benchmark
There is no universal good number, which is the first thing to accept about any return on equity benchmark. A reasonable rule of thumb places a healthy return on equity somewhere between 15% and 20% for a mature U.S. company, and figures near or below the cost of equity suggest the business is not creating much value for owners. But a rule of thumb is not a standard.
The correct return on equity interpretation is always relative. Compare a company to its own history and to direct competitors in the same industry. A 12% reading can be excellent for a capital-heavy utility and mediocre for an asset-light software business that should run far higher. Asset-light models carry little equity on the balance sheet, so they often post elevated returns; capital-intensive models carry a lot, so their returns look modest by design.
Trend matters more than the absolute level. A return on equity that has climbed steadily over five years usually reflects a strengthening business. One that is high but eroding can signal margins under pressure, an equity base ballooning faster than profits, or a one-time gain inflating last year's number. Read the direction before you read the level.
How investors use return on equity to screen stocks
In practice, return on equity is a filter, not a buy signal. Investors run a screen for companies that have sustained a high return on equity across several years, because durability separates a real competitive advantage from a single good quarter. A business that holds 20% through different demand environments is telling you something about pricing power and capital discipline that one strong year cannot.
From there the work begins. The next questions are where the return comes from and what you would pay for it. A high return on equity built on genuine margins and efficient asset use is worth far more than the same number manufactured through debt. Two companies can post an identical 18%; one funds it with retained earnings, the other with heavy borrowing that magnifies returns in good years and losses in bad ones. The ratio looks the same. The risk does not.
This is the part most checklists skip. What does return on equity tell investors on its own? That capital is being used efficiently right now. It says nothing about valuation. A company can earn a superb return on equity and still be a poor investment if the market has already priced in a decade of that performance. The metric measures the business; the price measures the expectation. A number without context is analysis with better vocabulary, not a decision.
Return on equity vs return on assets
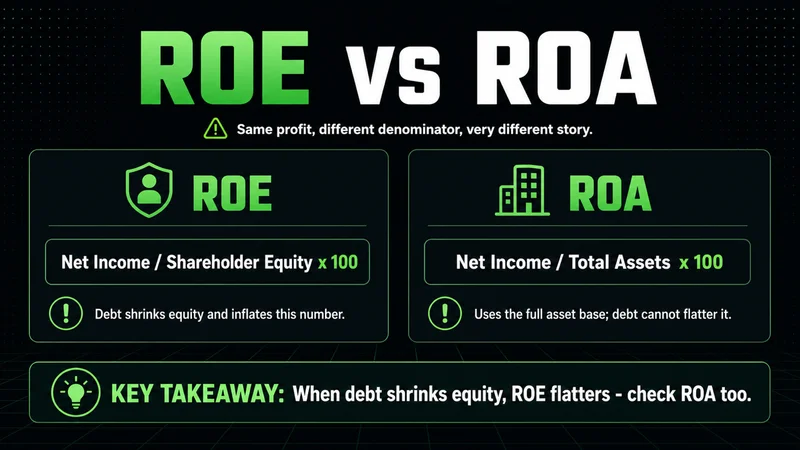
The return on equity vs return on assets distinction is where leverage hides. Return on assets divides net income by total assets, so it measures how well a company uses everything it controls, financed by both equity and debt. Return on equity divides the same net income by equity alone, the slice owners actually fund.
The space between the two ratios is debt. When return on equity sits far above return on assets, the company is using borrowed money to amplify the return on its equity base. That can be a sign of skilled capital management or a warning of fragility, depending on how much debt and how stable the earnings are. A company with a 20% return on equity and a 4% return on assets is leaning hard on leverage; one with 18% and 15% is generating its return mostly from the underlying business.
Reading the two together is what makes either useful. Return on equity alone rewards borrowing. Pairing it with return on assets, and with a glance at the debt load, shows you whether the return is earned by the business or rented from the balance sheet.
The limitations of return on equity and when it misleads
The limitations of return on equity are not edge cases; they are the reason the metric should never stand alone. The denominator is the weak point. Because return on equity divides by equity, anything that shrinks equity inflates the ratio without improving the business.
Sustained share buybacks are the clearest case. When a company repurchases stock, it reduces shareholders' equity, and a smaller denominator lifts return on equity even if net income is flat. The number improves; the operating performance has not. A reader who treats the higher figure as a stronger business has been misled by accounting, not informed by it.
The metric breaks down entirely at the extremes. A company carrying large losses or heavy debt can drive equity to near zero or negative territory. When equity is tiny, return on equity spikes to an absurd reading; when equity is negative, the ratio is meaningless and should be discarded, not interpreted. This is the condition where the framework inverts: the same formula that signals quality in a healthy balance sheet produces noise in a distressed one. A 60% return on equity on a sliver of equity is a symptom, not a strength.
Return on equity also ignores risk and says nothing about cash. A highly leveraged firm and a debt-free one can post the same number while facing completely different odds of surviving a bad year. And because net income is an accrual figure, a company can report rising profit and return on equity while its actual cash generation weakens. None of this makes the metric useless. It makes it one input among several, best read alongside return on assets, the debt level, free cash flow, and the price you are being asked to pay.
FAQs
What is a good return on equity? For a mature U.S. company, a return on equity between 15% and 20% is generally considered healthy, and a figure below the cost of equity suggests weak value creation. The real test is relative: compare the company to its own history and to direct competitors in the same industry, because what is strong for a utility is weak for an asset-light software firm.
What is the difference between return on equity and return on assets? Return on assets divides net income by total assets and measures how well a company uses all of its resources, funded by both debt and equity. Return on equity divides the same profit by equity alone. The gap between them reflects leverage, so a return on equity far above return on assets means borrowing is amplifying the result.
Why can a high return on equity be misleading? Because the ratio divides by equity, anything that shrinks the equity base lifts the number without improving the business. Heavy share buybacks and large accumulated losses both reduce equity and inflate return on equity, and when equity turns negative the ratio stops carrying any usable meaning.
How do investors actually use return on equity? As a screen rather than a decision. They look for companies that have sustained a high return on equity over several years, then dig into whether that return comes from genuine margins or from debt, and whether the current price already reflects it. The metric measures the business, not the value of the stock at today's price.
Worth the read?


