Maximum Drawdown — The Risk Number That Outranks Returns
Maximum drawdown is the largest peak-to-trough drop in your account, and the risk number that decides whether you survive long enough to keep returns.
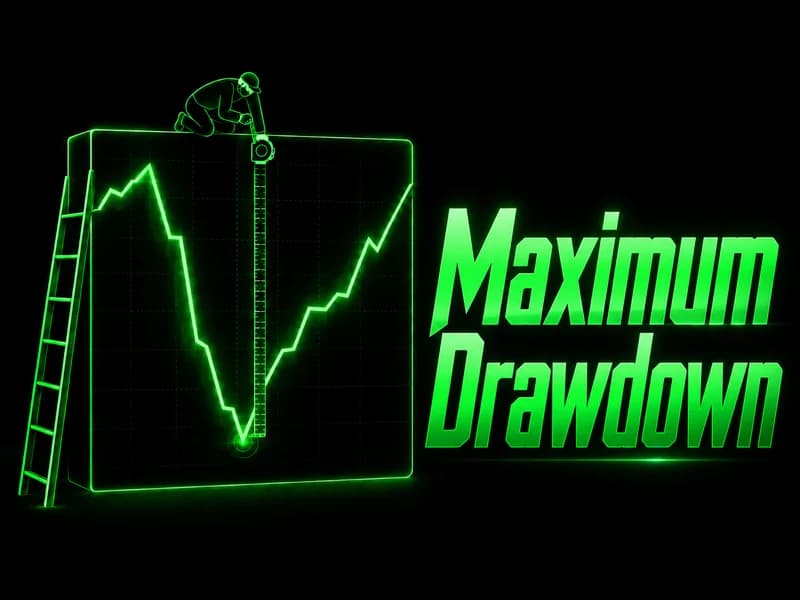
Maximum drawdown is the largest peak-to-trough drop your account suffers before it makes a new high, measured as a percentage of that peak. It is the single number that tells you how much pain a strategy put you through to produce its returns. Most beginners study the upside first and treat drawdown as an afterthought. That order is backward. The drawdown is what decides whether you are still trading when the good months finally arrive.
Returns get the attention because they feel like the point, while drawdown gets ignored because it feels like an admission. But a strategy can show a clean return figure and still have run your account down 40% along the way. If you cannot sit through that, the return on paper was never yours to keep.
What maximum drawdown actually measures
Maximum drawdown meaning comes down to one thing: the worst stretch of losses you would have lived through. It is not the size of a single bad trade. It is the cumulative decline from a high-water mark to the lowest point that follows, before the account recovers to a new peak. Picture your equity as a line that rises and falls; the deepest dip from any peak, over the period you are measuring, is the maximum drawdown.
The reason it outranks volatility is direction. Volatility counts moves up and down equally. Drawdown only counts the part that hurts: the decline from a peak. Two strategies can show the same volatility, while one buries you in a hole twice as deep. The drawdown separates them; the volatility hides the difference.
The maximum drawdown formula, and how to calculate it
The maximum drawdown formula is direct:
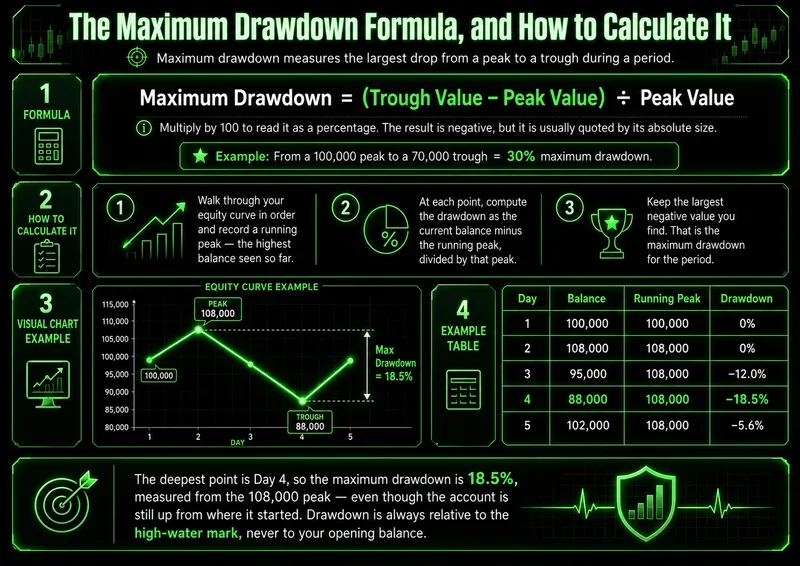
Maximum Drawdown = (Trough Value − Peak Value) ÷ Peak Value
Multiply by 100 to read it as a percentage. The result is negative, and the convention is to quote its absolute size. A move from a 100,000 peak to a 70,000 trough is a 30% maximum drawdown.
The maximum drawdown calculation across a track record follows a defined sequence:
Walk through your equity curve in order and record a running peak — the highest balance seen so far.
At each point, compute the drawdown as the current balance minus the running peak, divided by that peak.
Keep the largest negative value you find. That is the maximum drawdown for the period.
Here is a compact maximum drawdown example. The running peak updates only when the balance exceeds the prior high.
Day | Balance | Running peak | Drawdown |
|---|---|---|---|
1 | 100,000 | 100,000 | 0% |
2 | 108,000 | 108,000 | 0% |
3 | 95,000 | 108,000 | −12.0% |
4 | 88,000 | 108,000 | −18.5% |
5 | 102,000 | 108,000 | −5.6% |
The deepest point is Day 4, so the maximum drawdown is 18.5%, measured from the 108,000 peak — even though the account is still up from where it started. Drawdown is always relative to the high-water mark, never to your opening balance.
What a good maximum drawdown looks like for new traders
There is no single benchmark that fits every account, but the question of what is a good maximum drawdown for new traders has a practical answer: small enough that one bad stretch does not change how you trade. For most beginners, a maximum drawdown held under 10% to 15% of the account is workable. Past 20%, the math of recovery starts working against you, and so does your psychology.
The recovery math is the part traders underestimate. A 10% drawdown needs an 11% gain to get back to even. A 25% drawdown needs 33%, and a 50% drawdown needs a 100% gain just to return to the high-water mark. Deep holes do not recover in proportion.
Use the drawdown to set a risk budget you can act on. If you decide 12% is your line, that figure should drive your per-trade risk and your daily stop. Risking 2% per trade means roughly six consecutive losers takes you to the edge — common enough that you should plan for it, not be surprised by it. This is where maximum drawdown stops being a backward-looking statistic and becomes a forward-looking rule.
Why maximum drawdown matters in risk management
The reason maximum drawdown matters in risk management is that it measures survival, not performance. Protecting capital is the first objective. An account that avoids the deep hole stays in the game long enough for its edge to show up; an account that takes the deep hole often does not.
Drawdown also exposes a strategy's true character. A backtest with a tempting return and a 45% maximum drawdown is telling you something the headline number hides: at some point, you would have watched nearly half your capital disappear. The number that matters is not the one you tolerate in a spreadsheet; it is the one you tolerate at 2 p.m. on a red day.
This only holds while you actually respect the line you drew. Most blown accounts do not start with a bad strategy. They start with a trader who decided, in the middle of a drawdown, that this time the rule could bend. The metric is useless the moment you stop honoring it.
The most common maximum drawdown mistakes beginners make follow a pattern:
Increasing position size during a drawdown to win the losses back faster, which deepens the hole instead of climbing out of it.
Measuring drawdown only on closed trades while open positions quietly extend the real low.
Treating a backtest's maximum drawdown as a ceiling, when live conditions routinely produce a worse one.
Maximum drawdown vs profit factor, explained
Profit factor — gross profit divided by gross loss — tells you whether a strategy makes money. Maximum drawdown tells you what you endure to collect it. A strategy can post a strong profit factor and a brutal drawdown at once, because profit factor says nothing about the order in which wins and losses arrive. Ten losses in a row inside an otherwise profitable system produce the same profit factor and a far deeper drawdown. Read them together: profit factor answers whether the edge exists; maximum drawdown answers whether you can hold through the rough patch long enough to realize it.
Prop-firm rules complicate this further. Many firms enforce a trailing maximum drawdown that follows your highest balance intraday, not your closing balance. A position that runs in your favor and then gives the gain back can breach the limit even though you closed green. The word is the same, but the rule is stricter, and traders who skip the fine print fail challenges on math they did not know they were playing.
How to improve maximum drawdown over time
Knowing how to improve maximum drawdown over time is less about finding a better entry and more about controlling exposure. The drawdown shrinks when your losing streaks shrink, and that is a function of risk per trade, correlation between open positions, and your willingness to stand aside in low-quality conditions. Three levers do most of the work:
Reduce risk per trade. Cutting from 2% to 1% roughly halves the depth of any losing run, at the cost of slower recovery.
Avoid stacking correlated positions. Three trades that all depend on the same move are one trade wearing three tickets.
Trade less in unclear conditions. Forcing setups during chop is where most avoidable drawdown comes from.
Review the metric regularly, not only after a painful stretch. A simple maximum drawdown checklist for trading review — current drawdown from the high-water mark, the depth of your worst run this quarter, whether any single position drove it, and whether your rules held — turns the number into a habit instead of a postmortem.
FAQs
What is maximum drawdown in trading? It is the largest percentage decline from a peak in account value to the lowest point that follows, before a new peak is reached. It measures the worst loss stretch an account experienced over a given period.
Maximum drawdown explained for beginners — what is the simplest version? Picture your balance as a line over time. The biggest drop from any high down to the bottom before recovering is your maximum drawdown. It marks the worst pain the account went through.
How do you calculate maximum drawdown? Track a running peak of your equity, then at each point divide the difference between the current balance and the running peak by that peak. The largest negative result over the period is the maximum drawdown.
What is a good maximum drawdown for new traders? There is no universal number, but holding it under 10% to 15% keeps recovery realistic and protects your decision-making. Past 20%, the gain required to recover grows disproportionately and discipline tends to slip.
Why does maximum drawdown matter more than returns? Returns describe the reward; maximum drawdown describes whether you survive long enough to collect it. A high return paired with a deep drawdown usually means traders abandon the strategy before it pays off.
Worth the read?