
Return on Assets — What It Tells Investors
Return on assets measures how much profit a company earns per dollar of assets. Here is the formula, how to read it, and where it misleads.

Return on assets measures how much profit a company squeezes out of every dollar of assets it controls. The formula is net income divided by average total assets, expressed as a percentage. A 10% return on assets means the business earns ten cents on each dollar of assets it owns. That single number is useful, but the way most people read it is where the trouble starts.
The ratio is treated as a verdict when it is really a question. A high reading is supposed to mean a company is efficient and a low reading is supposed to mean it is not. In practice, return on assets only carries meaning inside its industry, across several years, and next to the balance sheet that produced it. Read alone, it flatters asset-light businesses and punishes asset-heavy ones for reasons that have nothing to do with management quality.
This is a fundamentals tool, not a signal. It tells you how hard a company's asset base is working. What you do with that information depends on context the ratio cannot supply on its own.
What return on assets actually measures
Return on assets, or ROA, links the income statement to the balance sheet. Net income comes from the income statement and represents profit after all expenses, interest, and taxes. Average total assets comes from the balance sheet and represents everything the company owns and uses to operate: cash, receivables, inventory, property, plants, and equipment.
Dividing one by the other answers a narrow question. For every dollar tied up in assets, how many cents of profit came back? A company with 5 million dollars in net income and 50 million dollars in average assets posts a 10% return on assets. A competitor earning the same 5 million dollars on 100 million dollars in assets posts 5%. Same profit, half the efficiency in asset terms.
That framing is the entire value of the metric. It is reactive, not predictive. It describes what already happened to a balance sheet over a reporting period; it does not forecast the next one.
The return on assets formula and how to calculate it
The standard formula is straightforward.
Return on assets = Net income / Average total assets
The detail that separates a clean calculation from a sloppy one is the word average. Total assets change across the year as a company buys equipment, draws down cash, or builds inventory. Using the year-end figure alone distorts the result, especially for a company that made a large purchase late in the period.
To calculate return on assets properly, work through these steps:
Pull net income from the bottom of the income statement for the period.
Find total assets at the start of the period and total assets at the end, both from the balance sheet.
Add the beginning and ending asset figures and divide by two to get average total assets.
Divide net income by average total assets.
Multiply by 100 to express the result as a percentage.
Here is a worked example. A company reports 8 million dollars in net income. It started the year with 90 million dollars in total assets and ended with 110 million dollars. Average total assets is 100 million dollars. Return on assets is 8 divided by 100, or 8%. For every dollar of assets the company carried on average, it generated eight cents of profit.
How to interpret return on assets
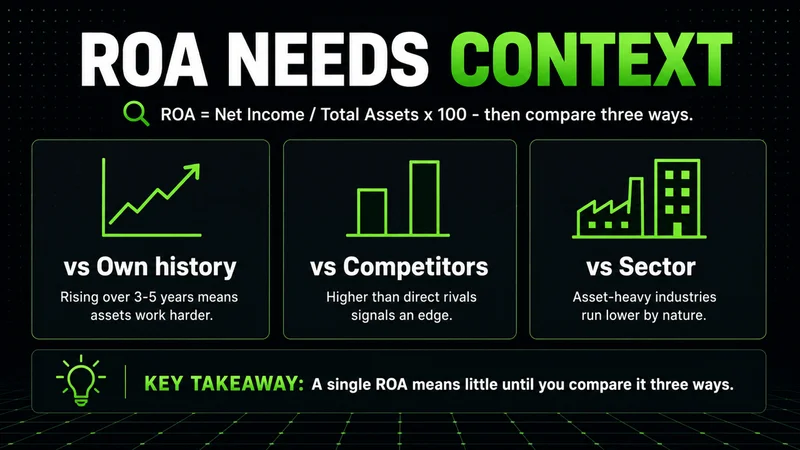
A return on assets figure means little until it has something to stand next to. Three comparisons give it context:
Against the company's own history. A ratio trending up over three to five years suggests the asset base is being used more productively. A steady decline is worth a closer look at margins or asset growth that is not yet earning its keep.
Against direct competitors. Comparing a software company to a railroad tells you nothing useful. Comparing two software companies of similar scale tells you which one converts its assets into profit more effectively.
Against the cost of capital. A return on assets below what it costs the company to fund those assets is a structural problem, regardless of how the number looks in isolation.
What counts as a good return on assets depends almost entirely on the industry. The asset spectrum splits roughly into two groups:
Asset-light businesses such as software, consulting, and asset managers routinely post double-digit figures because they generate profit without heavy property or equipment.
Capital-intensive businesses such as utilities, airlines, and manufacturers often run in the low single digits because their balance sheets are loaded with expensive physical assets.
Neither group is better managed. They sit on opposite ends of the asset spectrum, and a fair reading of return on assets respects that gap rather than ranking across it.
Return on assets versus return on equity
Return on assets and return on equity answer different questions, and confusing them leads to bad conclusions.
Return on assets measures profit against the entire asset base, no matter how those assets were financed. Return on equity measures profit against shareholder equity alone. The gap between the two is leverage.
Consider two companies with identical operations and identical 6% returns on assets. One funds itself entirely with equity. The other funds half its assets with debt. The leveraged company will show a substantially higher return on equity, because the same profit is measured against a smaller equity base. Its return on assets, however, stays at 6%. Nothing about the underlying business improved; the capital structure simply amplified the equity return.
This is why return on assets is often the more honest efficiency measure. It cannot be inflated by borrowing. When return on equity looks impressive but return on assets is mediocre, leverage is usually doing the heavy lifting, and leverage cuts in both directions.
How investors actually use return on assets in stock analysis
Most explainers stop at the formula. The harder part is folding the ratio into a repeatable process without letting it mislead you. A workable checklist looks like this:
Calculate return on assets for at least three consecutive years to establish a trend rather than a snapshot.
Compare only against companies in the same industry with similar asset structures.
Cross-check return on assets against return on equity to see how much of the equity return depends on debt.
Confirm the net income figure is not distorted by one-time gains, asset sales, or write-downs that will not repeat.
Read the asset side of the balance sheet to understand whether the base is mostly cash, inventory, or fixed assets, because each behaves differently.
A practical distortion to watch for involves asset-light versus asset-heavy companies. A retailer that leases all its stores can show a far higher return on assets than a competitor that owns its real estate, simply because the leased assets never appear on the balance sheet in the same way. The leaner ratio does not always mean the leaner operation. It often means the assets moved off the books.
The deeper principle is that a ratio without context is gambling with better vocabulary. Return on assets earns its place in analysis only when it sits alongside the structure, the history, and the industry that produced it.
Where return on assets breaks down
This ratio is reliable inside its boundaries and misleading outside them. It breaks down in several common situations:
Across industries. A 4% return on assets at a utility and a 4% return at a software company describe completely different realities, and ranking them against each other is meaningless.
During heavy investment years. A company that spends aggressively on new plants or acquisitions inflates its asset base before those assets produce profit. Return on assets dips, not because the business weakened, but because the denominator grew first and the earnings follow later.
With aging assets. A company running old, heavily depreciated equipment carries a smaller asset base on the books, which lifts return on assets even as the equipment quietly approaches the end of its useful life. The ratio looks healthy right up until the replacement bill arrives.
On the question of debt. Two companies with the same return on assets can carry very different risk profiles depending on how much of the asset base is borrowed. The ratio is silent on the financing that sits underneath it.
None of this makes return on assets weak. It makes it specific. The metric works precisely as designed when you respect what it covers and stop asking it to answer questions it was never built for.
Common return on assets mistakes beginners make
A few errors show up repeatedly and quietly corrupt the analysis:
Using year-end total assets instead of the average, which skews the result whenever the balance sheet changed materially during the year.
Comparing companies across unrelated industries and treating the higher number as the better business.
Reading a single year in isolation and missing the trend that actually carries the signal.
Ignoring one-time items in net income, so an asset sale or tax benefit makes a flat year look strong.
Treating return on assets and return on equity as interchangeable, which hides the role leverage is playing.
Avoiding these is less about math and more about discipline: define what the ratio can tell you, then refuse to read more into it than the numbers support.
FAQs
What is return on assets in simple terms? It is the percentage of profit a company earns relative to everything it owns. You calculate it by dividing net income by average total assets. A higher figure means the company converts its asset base into profit more efficiently.
What is a good return on assets? There is no universal threshold. A good return on assets is one that beats the company's own history and its direct industry peers. Asset-light industries often post double digits, while capital-intensive industries may run in the low single digits and still be well run.
How do you calculate return on assets? Divide net income from the income statement by average total assets, then multiply by 100. Average total assets is the beginning-of-period figure plus the end-of-period figure, divided by two. Using the average rather than a single date keeps the result honest.
What is the difference between return on assets and return on equity? Return on assets measures profit against all assets regardless of financing. Return on equity measures profit against shareholder equity alone. The difference between them reflects how much debt the company uses, since leverage raises return on equity without changing return on assets.
Why can return on assets be misleading? Because it only holds meaning inside a single industry, across multiple years, and next to the balance sheet that produced it. Compared across industries, distorted by heavy investment years, or read in isolation, it produces conclusions the underlying business does not support.
Related reading
To build a fuller picture of how efficiently a company operates and how it is financed, pair return on assets with the metrics that sit beside it on the same statements:
Return on equity shows how leverage shapes shareholder returns and exposes the debt that return on assets ignores.
Net profit margin isolates how much of each sales dollar survives to the bottom line.
The debt-to-asset ratio reveals how much of the asset base is borrowed, which is exactly the context return on assets leaves out.
Read together, these ratios describe efficiency, profitability, and financial structure as one connected story rather than four isolated numbers.
Worth the read?


