
Support and Resistance Setups Need Confirmation
Support and resistance setups improve when direction, level reaction, confirmation, and structural invalidation align before entry.

Support and resistance setups are not trades by themselves. They are locations where price may react. A valid setup appears only when market direction, level behavior, confirmation, and risk align. The level provides context. The reaction provides evidence. Invalidation defines when the idea is wrong.
A trader who enters because price merely touched support or resistance is predicting. A trader who waits for defense, rejection, acceptance, or a confirmed break is reacting to information.
“A level matters only after price reaction confirms it.” — MRPNL
Support and resistance setups begin with reaction
Support is an area where buyers have previously defended price. Resistance is an area where sellers have previously capped it. Neither area guarantees another reversal. It marks a location where the next reaction deserves attention.
Watch whether price rejects the area, accepts beyond it, or moves through it without hesitation. Rejection can preserve the level. Acceptance can signal that control has shifted. A brief wick through the boundary is less meaningful than a close beyond it followed by continuation or a successful retest.
Context still controls the setup. Support inside a downtrend may produce only a temporary bounce. Resistance inside an uptrend may cause a pause without changing direction.
Trendline support and resistance require intact structure
A rising trendline connects higher lows and can help organize an uptrend. A falling trendline connects lower highs and can help organize a downtrend. The line frames structure. It does not make every touch a reversal.
In an uptrend, a pullback toward a rising trendline can support a long idea when buyers defend the area and maintain the higher-low sequence. In a downtrend, a rally toward a falling trendline can support a short idea when sellers reject the area and lower highs remain intact. A close through the line matters more when it also breaks the swing structure that gave the trendline meaning.
The chart should distinguish a trendline hold from a confirmed trendline break. Show a rising sequence of higher lows on the left and a failed higher low with acceptance below the line on the right. Label the reaction, confirmation, and structural invalidation so the line is treated as context rather than an automatic entry.
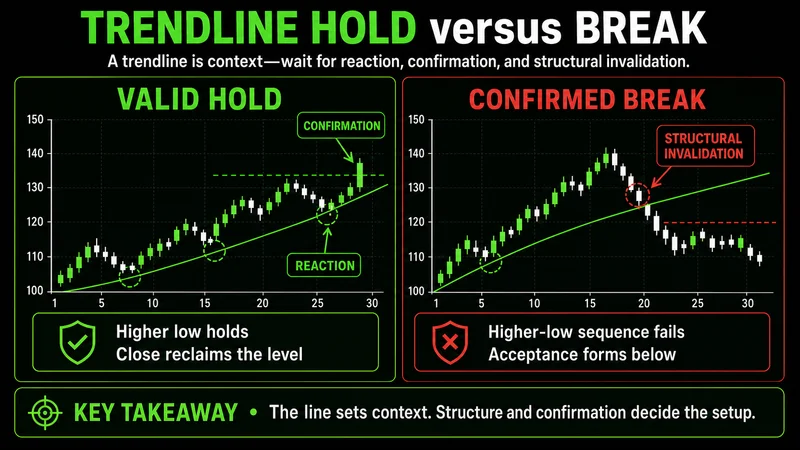 A trendline remains useful only while the swing structure supporting it stays intact.
Forcing a line to fit price is a common mistake. If repeated adjustments are required to preserve a preferred bias, the trendline is defending an opinion instead of clarifying structure.
Supply and demand zones frame broader reactions
Supply and demand zones treat support and resistance as areas instead of exact prices. A supply zone is an upper area associated with repeated rejection or strong selling. A demand zone is a lower area associated with repeated defense or strong buying.
This framing accounts for price probing beyond an edge before responding. Repeated rejection near supply can support a short bias. Repeated bounces from demand can support a long bias. A clean close beyond the zone, followed by continuation or a retest, can indicate that control has shifted.
Show supply and demand as equal comparison panels. The supply panel should teach repeated upper rejection, a confirmed close below opposing support, and risk beyond the zone. The demand panel should teach repeated lower defense, a confirmed close above opposing resistance, and risk beyond the opposite edge. Use only generic round levels.
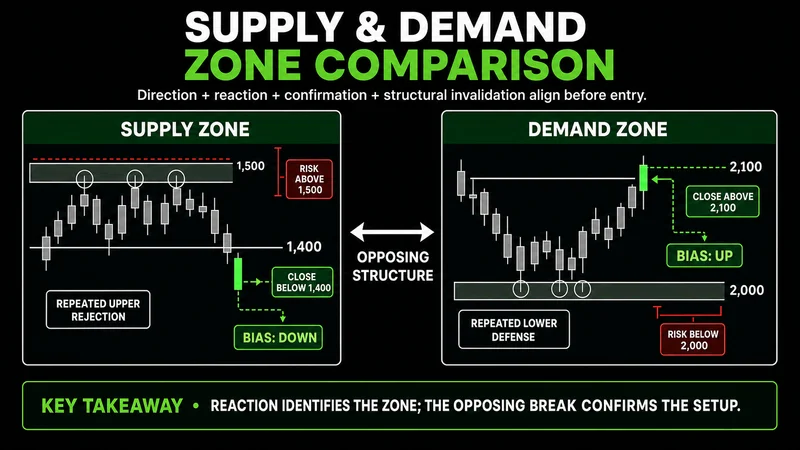 Zones frame the decision area; closing behavior and retests show whether control has shifted.
Do not treat one wick as a confirmed breakout. A wick may be a probe that immediately fails. Confirmation improves when price closes beyond the area and either follows through or retests the broken boundary without returning through the zone.
Pivot points organize repeatable decision areas
Pivot points create a consistent map of potential support and resistance. The central pivot is commonly surrounded by resistance levels above it and support levels below it.
Price can bounce from a pivot, reject resistance, break and retest a level, or break down through support. The label matters less than the reaction. A rejection may preserve resistance. A close above it, followed by a successful retest, can turn former resistance into support.
Strong displacement can carry price through several pivot levels. Fading the next line solely because it is labeled resistance ignores momentum and acceptance.
Moving averages provide dynamic support and resistance
A moving average changes with price, so it can act as a dynamic reference. During an orderly advance, price may pull back toward the average and bounce. During an orderly decline, rallies may fail near it.
A long setup improves when price holds above the average, defends support, and resumes with the broader structure. A short setup improves when price remains below the average and rejects resistance. The average supplies context, while price behavior supplies the decision.
The average does not cause the reaction. In unclear structure, repeated crossings can produce conflicting signals and low-quality entries.
Long and short entries use the same logic
Long and short setups are mirror images in process. A long idea looks for defense at support, demand, a rising trendline, or a relevant moving average. A short idea looks for failure at resistance, supply, a falling trendline, or a moving average above price.
For a long example, assume price pulls back into a previously defended demand zone while the broader structure still shows higher lows. Price probes the zone, closes back above its boundary, and holds that boundary during a retest. The entry comes after defense is visible. Invalidation belongs beyond the level that must hold, not at an arbitrary distance chosen after entry.
The short version reverses the logic. Price rallies into supply within a lower-high sequence, rejects the area, and closes below nearby support. A weak retest that fails beneath the broken level can confirm seller control. If price reclaims the zone and holds above it, the short thesis is invalid.
Confirmation separates a setup from a location
Confirmation should answer a practical question: what did price do that supports this bias? Useful evidence includes a defended close, rejection followed by displacement, a break with follow-through, or a retest that holds the new side of a level.
The sequence matters. Direction comes first. The level identifies the decision area. The reaction shows participation. Confirmation supports execution. Invalidation defines the exit condition. When those parts conflict, patience is usually the higher-quality decision.
Build the execution checklist as five ordered checks: broader direction, relevant level, visible reaction, closing confirmation, and defined invalidation. The final branch should show “Trade” only when all five align and “Wait” when any condition remains unclear.
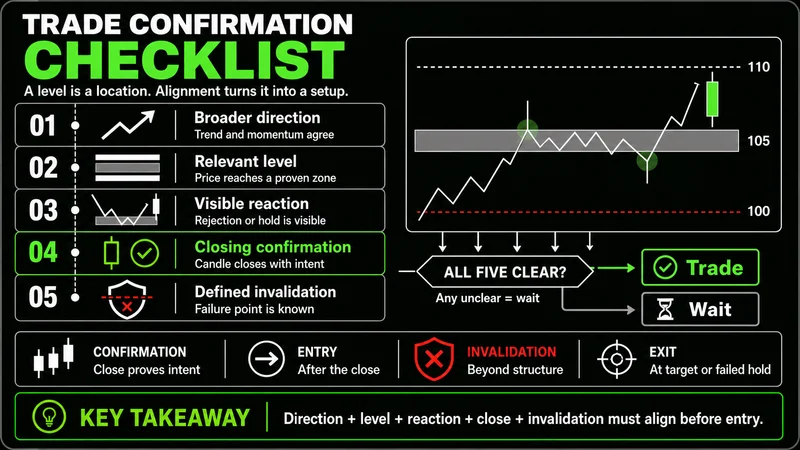 A setup is complete only when its direction, location, reaction, confirmation, and invalidation agree.
Confirmation does not remove risk. It reduces the need to guess. Waiting may produce a later entry or no entry, but it filters touches that never develop into controlled setups.
Defined invalidation keeps risk connected to structure
Invalidation is the price behavior that proves the setup no longer has its required structure. For a long based on demand, that may be a close below the defended zone with acceptance underneath. For a short based on supply, it may be a close above the zone followed by continued buying.
Risk should sit beyond the condition that defines the idea when structure permits a practical distance. If invalidation is too far away for controlled exposure, reducing size or skipping the setup is more disciplined than placing a stop inside ordinary price noise.
Do not change invalidation after entry merely because the trade is uncomfortable. Widening risk without a structural reason converts a planned trade into an emotional decision.
When support and resistance trading does not work
Support and resistance trading becomes unreliable when volatility expands sharply, liquidity is thin, or price moves through levels without stable acceptance or rejection. Trendlines, zones, pivots, and moving averages can fail in rapid succession because the market is repricing faster than static references can organize it.
The framework also loses value in a tight, directionless range where price repeatedly crosses the same average and both sides of nearby zones. Reactions appear, but follow-through does not. Entries taken at every touch become vulnerable to noise and repeated small losses.
When this happens, a more aggressive entry is not the answer. Wait for cleaner structure, stronger confirmation, or an area where invalidation can be defined outside normal rotation.
Apply the framework as a decision process
Start by marking only the clearest trendline, zone, pivot, or moving-average reference. Determine whether broader structure favors long positions, short positions, or neither. Then wait for price to reach the area and show a reaction.
Before execution, state the required confirmation and invalidation in plain language. If price must hold above demand, define what “hold” means before the test. If a short requires rejection from supply, decide whether a close and failed retest are required. The stricter standard is a close beyond the zone plus follow-through or retest confirmation.
The practical edge is not the number of levels on the chart. It is the discipline to separate location from evidence. Direction, reaction, confirmation, and risk must align. When one is missing, the setup is incomplete.
Worth the read?


