Valuation Ratios — How to Read What the Market Pays
Valuation ratios show what the market pays for a stock relative to its fundamentals — here is how to read, calculate, and interpret them without misfiring.
Valuation ratios measure what the market is paying for a company relative to something fundamental it produces — earnings, sales, book value, or cash flow. They do not tell you whether a stock is good. They tell you what price the crowd has already agreed on, expressed as a multiple you can compare across companies and across time. Read that way, a valuation ratio is a question, not an answer.
Most people use them backward. They see a low price-to-earnings number, decide the stock is cheap, and buy. The ratio was never the signal. It was the start of the work.
What valuation ratios actually mean
A valuation ratio divides a company's market price by a per-share fundamental. The price sits on top because it is the variable the market sets minute by minute. The fundamental sits on the bottom because it changes slowly, on a reporting schedule. The ratio is the bridge between what the business earns and what investors will pay to own that stream.
That framing matters for interpretation. When a multiple expands, either the price rose, the fundamental fell, or both. A rising price-to-earnings ratio can mean optimism about future growth, or it can mean earnings collapsed while the price held. Same number, opposite story. The ratio alone cannot separate the two, which is why a single multiple read in isolation is closer to a guess than an analysis.
Valuation ratios belong to fundamental analysis, but they sit at its surface. They summarize the market's current opinion. The deeper work — reading the income statement, the balance sheet, and the cash flow — is what tells you whether that opinion is reasonable.
The core valuation ratios and their formulas
A handful of ratios carry most of the weight in stock analysis. Each one answers a specific question, and the formula tells you what question that is.
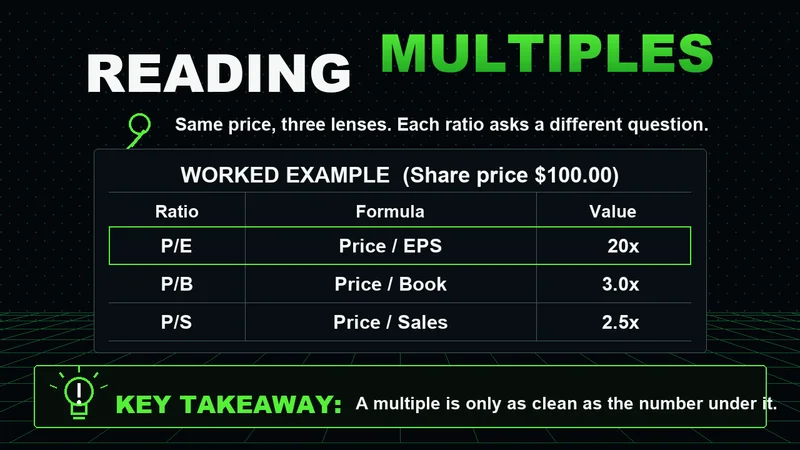
- Price-to-Earnings (P/E) = market price per share / earnings per share. The price of one dollar of current earnings. The most quoted multiple, and the most misread.
- Price-to-Sales (P/S) = market price per share / revenue per share. Useful when earnings are negative or distorted, because revenue is harder to manipulate than profit.
- Price-to-Book (P/B) = market price per share / book value per share. The price relative to net assets on the balance sheet. More meaningful for asset-heavy businesses than for software companies whose value is intangible.
- PEG = P/E ratio / annual earnings growth rate. The P/E adjusted for how fast earnings are expanding. A high P/E on a fast grower can be cheaper than a low P/E on a stagnant one.
- EV/EBITDA = enterprise value / earnings before interest, taxes, depreciation, and amortization. The valuation including debt, which is why acquirers favor it over P/E. It compares companies with different capital structures more fairly.
- Dividend yield = annual dividend per share / market price per share. The cash return a shareholder receives at the current price, before any capital gain.
The formula is the easy part. Every one of these is a single division. The judgment is in choosing which ratio fits the business and then deciding what the number is telling you.
How to interpret a valuation ratio in context
A multiple has no meaning on its own. The number 18 is neither high nor low until you give it a reference. Interpretation is comparison, and there are three references worth using.
The first is the company's own history. A stock trading at 18 times earnings means one thing if it has averaged 30 for a decade and another if it has averaged 12. The trend tells you whether the market's opinion is improving or deteriorating.
The second is the sector. Telecommunications and utilities carry low multiples because their growth is slow and their cash flows are stable. Software and biotech carry high multiples because investors are paying for growth that has not arrived yet. Comparing a utility's P/E to a software company's is comparing two different questions.
The third is the broader market. A P/E of 20 reads differently when the index average is 15 than when it is 25. The same multiple is expensive or cheap depending on the room it sits in.
The market rewards patience far more than activity. A multiple that looks attractive today is often just an early read on a story that has not finished developing — and forcing a decision before the context fills in is usually expensive.
A worked valuation ratios example
Consider two companies in the same sector. The comparison is where a single ratio turns into an actual read.
| Metric | Company A | Company B |
|---|---|---|
| Share price | $50 | $80 |
| Earnings per share | $2.50 | $2.00 |
| P/E | 20 | 40 |
| Revenue growth | 6% | 28% |
| PEG | 3.3 | 1.4 |
On P/E alone, Company A looks cheap at 20 and Company B looks expensive at 40. The headline read says buy A, avoid B. But the PEG ratio inverts that. Company B's earnings are growing more than four times as fast, so the higher P/E is buying growth that A simply does not have. Adjusted for growth, B is the lower multiple.
This is the whole lesson of valuation ratios in one table. The first number you see is rarely the number that matters. The work is finding the second ratio that reframes the first.
Where valuation ratios break down
This is the part most explainers skip. Valuation ratios assume the denominator is clean and representative. When it is not, the ratio lies, and it lies most convincingly when it looks cheapest.
Cyclical earnings are the first trap. A steel producer at the top of its cycle posts record earnings, so its P/E looks low and the stock looks cheap. Then the cycle turns, earnings fall by half, and the same price now sits on a P/E twice as high. The cheap multiple was a peak-earnings illusion. The framework inverts exactly when the headline number is most attractive.
One-off items are the second. A company books a large asset sale or a tax benefit, earnings spike for a single quarter, and the trailing P/E drops. Nothing about the underlying business changed. The ratio moved because the denominator did, and a reader who does not open the income statement walks straight into it.
Buybacks are the third, and the most overlooked. A company repurchasing shares shrinks the share count, which lifts earnings per share even if total profit is flat. The per-share denominator rises mechanically, the P/E falls, and the stock looks cheaper without the business improving at all. The ratio reflects financial engineering, not value.
The pattern across all three is the same. A valuation ratio is only as honest as the fundamental beneath it, and the fundamental is most distorted precisely when the multiple looks most appealing.
Valuation ratios vs profitability ratios
These two families get confused constantly, and the confusion produces bad reads. They answer different questions, and you need both.
A valuation ratio compares price to a fundamental — it tells you what the market is paying. A profitability ratio, such as return on equity or net margin, stays inside the business and tells you how efficiently the company converts capital and sales into profit. One looks at the price tag. The other looks at the quality of what is in the box.
Reading a multiple without the profitability context behind it is guessing. A low P/E on a company with collapsing margins is cheap for a reason. A higher P/E on a company with rising return on equity may be the better value despite the larger number. The valuation ratio frames the price; the profitability ratio tells you whether that price is buying a good business or a deteriorating one. Used together, they check each other. Used alone, either one misleads.
A valuation ratios checklist for stock analysis
Before a multiple drives any decision, it has to survive a few questions. This is the order that keeps the read honest.
- Which ratio fits this business? Asset-heavy leans on P/B; unprofitable but growing leans on P/S; leveraged companies lean on EV/EBITDA.
- Is the denominator clean? Check for cyclical peaks, one-off items, and buyback distortion before trusting the number.
- What are the three references? Compare against the company's history, its sector, and the broader market — never the bare number.
- Does the profitability picture agree? Pair the valuation read with margins and return on equity to see whether the price is buying quality.
- What would prove me wrong? Define the condition — a margin reversal, a cyclical turn, a fundamental miss — that would invalidate the read before you act on it.
Run a multiple through that sequence and it stops being a headline and becomes analysis. Skip it, and you are trading on the first number you saw.
FAQs
What is a good valuation ratio? There is no universal good number. A P/E of 15 is reasonable for a mature, slow-growing company and expensive for one whose earnings are shrinking. The right reference is the company's own history, its sector peers, and the broader market — a ratio is only good or bad relative to those.
How do you calculate valuation ratios? Each one divides the market price by a per-share fundamental. P/E is price divided by earnings per share, P/S is price divided by revenue per share, P/B is price divided by book value per share. The arithmetic is simple division; the judgment is choosing the right fundamental for the business.
How do investors use valuation ratios? Investors use them to compare what the market is paying for similar companies and to track how that opinion changes over time. The ratios screen and frame candidates rather than decide them — the deeper read of the financial statements determines whether the price is justified.
What are the main limitations of valuation ratios? They are only as reliable as the fundamental beneath them. Cyclical earnings, one-off items, and share buybacks all distort the denominator and make a stock look cheaper than it is. A clean-looking multiple on a distorted denominator is the most common way the ratios mislead.
How do valuation ratios help decide if a stock is expensive? They translate price into a multiple you can compare against history, sector, and market. A stock is expensive when its multiple sits well above those references without faster growth or stronger profitability to justify the premium — and cheap only when the lower multiple is not hiding a deteriorating business underneath.
Worth the read?