
Fundamental Analysis — What It Measures and Why
Fundamental analysis values a company by its business, not its price. Here is what it measures, the metrics that matter, and where the framework breaks down.

Fundamental analysis is the practice of valuing a company by its business, not its price. You read the financial statements, the metrics, and the conditions the company operates in, then estimate what the shares are actually worth. The market price is the question. Intrinsic value is your attempt at an answer. When the two diverge far enough, you have a reason to act.
That sounds clean on paper. In live markets it is slower, messier, and more about judgment than most beginner guides admit. A number on a balance sheet tells you what happened last quarter. It does not tell you what price will do tomorrow. Fundamental analysis builds the case for a position over months and years. It is a tool for conviction and context, not for timing.
What fundamental analysis means in plain terms
The fundamental analysis meaning is simple once you strip the jargon. You are trying to answer one question: is this business worth more or less than the market is charging for it. Everything else is process built around that question.
The approach assumes price and value are not the same thing at every moment. Over a long enough horizon they tend to converge. Over a short horizon, liquidity, positioning, and sentiment can pull price far away from any reasonable estimate of value. A fundamental case is a bet that the gap closes. The risk is that it stays open longer than your patience, or your capital, can hold.
The fundamental analysis framework: top-down and bottom-up
There are two ways into the same problem, and serious work usually blends them.
The top-down path starts wide and narrows. You read the macro backdrop first: growth, inflation, interest rates, and the policy stance behind them. Then the sector, then the company. Rates matter here more than beginners expect. When the cost of capital rises, the present value of future earnings falls, and richly valued growth names feel it first.
The bottom-up path starts with the single business and works outward. You read the company on its own merits, then check whether the sector and the broader economy support or threaten the thesis. Most discretionary traders I respect lean bottom-up for conviction and use top-down to size and time exposure.
Neither path is complete alone. The fundamental analysis framework is just the discipline of moving between the two without losing the thread.
Reading the three financial statements
Every fundamental case is built on three documents, and you cannot skip any of them.
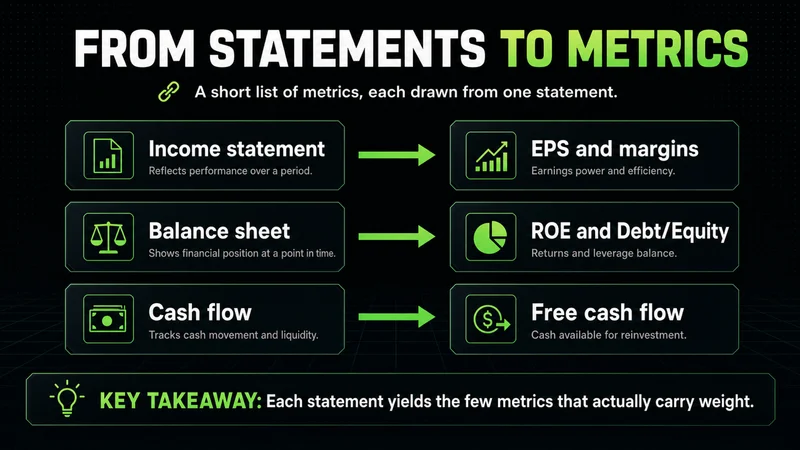
The income statement shows revenue, costs, and what is left as profit over a period. It answers whether the business makes money.
The balance sheet is a snapshot of what the company owns and owes on a single day. It answers whether the business can survive a bad stretch.
The cash flow statement tracks the actual cash moving in and out. It answers whether reported profit is real or an accounting artifact.
Profit on the income statement and cash in the bank are not the same thing. A company can report earnings while bleeding cash, and the cash flow statement is where that shows up first. Read all three together or you are reading a partial picture.
The fundamental analysis metrics that actually carry weight
The list of available ratios is long. The list that earns its place in a first pass is short. These are the fundamental analysis metrics worth learning before any others.
Earnings per share, or EPS, divides net profit across the shares outstanding. It is the base unit of most valuation work.
The price-to-earnings ratio compares price to those earnings. On its own it means little. Against the company's own history and its direct peers, it tells you whether the market is paying up or marking down.
Return on equity measures how much profit the business generates on the capital shareholders left in it. Persistently high return on equity is a sign of a real competitive edge.
The debt-to-equity ratio shows how much of the business is funded by borrowing. High leverage magnifies returns in good conditions and magnifies losses in bad ones.
No single number decides anything. A low price-to-earnings ratio can mean a bargain or a business the market expects to shrink. Context decides which, and context is the part no ratio gives you.
Fundamental analysis vs technical analysis
The two methods answer different questions, and the fundamental analysis vs technical analysis debate usually misses that.
Dimension | Fundamental analysis | Technical analysis |
|---|---|---|
Core question | What is the business worth | What is price likely to do next |
Primary inputs | Financial statements, metrics, economic conditions | Price, volume, market structure |
Typical horizon | Months to years | Minutes to weeks |
Best use | Conviction and context | Timing and execution |
Treating them as rivals is a beginner's mistake. Fundamentals tell you what to consider owning and why. Technicals and market structure tell you when the timing and the risk are reasonable. I trade index futures on structure and liquidity, but I never ignore the macro and earnings backdrop that sets the regime the structure forms inside. The two layers answer different parts of the same problem.
A fundamental analysis checklist you can actually run
A fundamental analysis example is more useful as a repeatable process than as a single stock writeup. Run the same checklist every time so your conclusions stay comparable.
Read the macro and rate backdrop. Decide whether conditions favor or threaten the sector.
Read all three financial statements for the last several years, not just the latest quarter. Trends matter more than any single print.
Pull the core metrics: EPS, the price-to-earnings ratio, return on equity, and debt-to-equity. Compare each against the company's own history and its peers.
Assess the qualitative side: the competitive moat, management quality, and the durability of the business model. Numbers are backward-looking; the moat is what protects them.
Estimate a rough intrinsic value and compare it to the market price. Write down what would prove you wrong before you act.
That last step is the one most beginners skip. A thesis without a defined invalidation is not a thesis. It is a hope with a spreadsheet attached.
The market does not care about opinions, effort, or conviction. Risk exists whether you acknowledge it or not.
When fundamental analysis stops working
This is the part the beginner guides leave out, and it matters more than any ratio. Fundamental analysis describes value over a long horizon. It does not protect you on a short one.
In liquidity-driven and macro-shock conditions, intrinsic value stops mattering on any tradable timeframe. A rate surprise, a credit event, or a forced unwind can move price violently while the underlying business is unchanged. The most carefully built fundamental case is irrelevant during a liquidation; positioning and liquidity decide the move, and they decide it fast. The framework holds over years. It can be useless over the next three sessions, and confusing those two horizons is how patient analysts get run over.
The common fundamental analysis mistakes beginners make follow from that confusion. Anchoring to a price target and refusing to update when the facts change. Treating a low valuation as a floor when the market is repricing the whole sector. Ignoring the balance sheet until leverage becomes the story. Each one comes from forgetting that being right about value and being right about timing are separate problems.
What to take from this
Fundamental analysis is the work of deciding what a business is worth and why, using its statements, its metrics, and the conditions it operates in. The framework moves between the macro backdrop and the single company, rests on all three financial statements, and leans on a handful of metrics read in context rather than in isolation. It builds conviction and supplies context, and it pairs naturally with technical and structural reads that handle timing.
It is not a timing tool, and it is not a shield against volatility. Value converges with price over years, not over sessions. Hold the analysis with patience, define what would prove the thesis wrong before you commit capital, and respect the conditions where the framework simply does not apply. That discipline, more than any single ratio, is what separates analysis that survives from analysis that gets repriced.
Worth the read?


