
Interest Coverage Ratio — How to Read It Like an Analyst
The interest coverage ratio measures how comfortably operating earnings cover a company's interest expense. Here is how to calculate and read it.

The interest coverage ratio measures how many times a company's operating earnings can cover its interest expense. You calculate it by dividing earnings before interest and taxes, or EBIT, by interest expense for the same period. A result of 4 means the business earned four dollars of operating profit for every dollar of interest it owed. That single number tells you whether debt is a manageable cost or a slow-moving threat to solvency.
Most explanations stop at the formula and a verdict that higher is better. That is where the useful work actually begins. A ratio is a starting question, not an answer, and the same figure can mean safety in one business and fragility in another. What matters is the cash behind the earnings, the stability of those earnings across a cycle, and the trend over several years rather than the snapshot from one good quarter.
What the interest coverage ratio actually measures
The interest coverage ratio describes a company's ability to service the interest on its debt out of current operating profit. It is sometimes called the times interest earned ratio, and the two terms point to the same calculation. The output is a multiple. A coverage of 6 says operating earnings could fall by roughly five-sixths before interest payments stopped being covered by profit alone.
The ratio sits inside a family of solvency measures, but it answers a narrower question than most of them. It does not ask whether a company can repay principal or survive a refinancing. It asks one thing: can the business keep paying the interest that keeps its lenders from acting. That focus is what makes it useful to credit analysts, lenders writing covenants, and equity investors checking how much room a balance sheet has before financing costs start eating into returns.
The interest coverage ratio formula and how to calculate it
The interest coverage ratio formula is straightforward:
Interest Coverage Ratio = EBIT / Interest Expense
EBIT comes from the income statement. Start with operating income, or build it from revenue minus the cost of goods sold and operating expenses, before interest and taxes are deducted. Interest expense is the total interest owed on debt during the same period, usually a line item near the bottom of the income statement.
To calculate the interest coverage ratio, follow a short sequence:
- Locate operating income, or compute EBIT by adding interest and taxes back to net income.
- Find the period's interest expense, gross rather than net of interest income.
- Divide EBIT by interest expense.
- Read the result as a multiple, not a percentage.
Use matching periods. Annual EBIT against annual interest, or quarterly against quarterly. Mixing a full year of earnings against one quarter of interest produces a number that looks reassuring and means nothing.
An interest coverage ratio example worth walking through
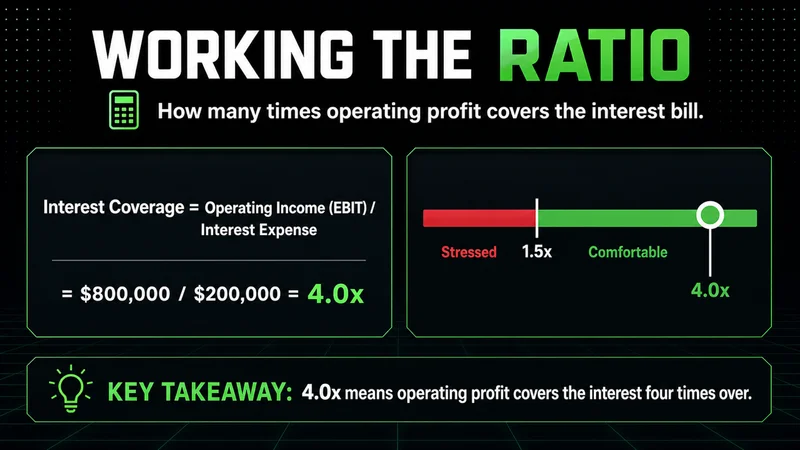
Consider a company that reports operating income of 800,000 dollars for the year and pays 200,000 dollars in interest. The interest coverage ratio is 800,000 divided by 200,000, or 4.0. The business earned four times the operating profit it needed to cover its interest.
Now change one input. Suppose a slowdown cuts operating income to 300,000 dollars while interest expense stays at 200,000. Coverage drops to 1.5. Nothing about the debt changed. The earnings that service that debt simply shrank, and the cushion went with them. This is the part of the example that matters more than the arithmetic: the ratio moves with the numerator far more violently than most readers expect, because interest expense is largely fixed while EBIT is not.
What is a good interest coverage ratio, and where the benchmark breaks
The common benchmark works in tiers:
- Above 3: comfortable coverage, with a wide cushion against an earnings decline.
- Between 2 and 3: acceptable for most stable businesses.
- Between 1 and 1.5: real strain, where a modest drop in earnings threatens the payments.
- Below 1: the company is not earning enough to cover interest at all and is funding the gap from cash reserves, asset sales, or new borrowing.
Those rules of thumb are a reasonable starting point.
They are also where a careless reading goes wrong. A coverage of 3 is healthy for a regulated utility with stable, predictable cash flows. The same 3 is thin for a cyclical manufacturer whose EBIT can halve in a downturn, because the benchmark assumes earnings hold steady and cyclical earnings do not. The right benchmark is industry-relative and cycle-aware, not a single universal threshold.
This is where the metric quietly fails the people who lean on it hardest. A single strong year can lift the ratio well above any covenant while the multi-year trend is deteriorating underneath. One large non-recurring gain inside EBIT can flatter coverage that operating performance never earned. The number reads cleanly in a stable year on a normalized income statement. Drop it into a cyclical business at the top of its cycle, or a year with a one-time gain inflating EBIT, and the same comfortable figure can mask a balance sheet that tightens fast when conditions turn.
How to interpret the interest coverage ratio beyond the number
A disciplined reading runs three checks before it trusts the number:
- The trend across several periods, not the single snapshot.
- The quality of the EBIT, normalized for one-time items.
- The cash behind the earnings, by comparing EBIT to operating cash flow.
Interpretation starts with the trend. One period tells you the current cushion. Three to five periods tell you the direction, and direction is what predicts trouble. A ratio falling from 8 to 5 to 3 over three years is more concerning than a steady 2.5, even though the steady company has the lower absolute number, because the first is describing erosion and the second is describing a stable, if modest, equilibrium.
Then check the earnings quality behind EBIT. Operating profit can be lifted by accounting choices, asset sales, or items that will not repeat. Coverage built on durable, recurring operating income is worth more than the same multiple built on a one-time boost. The cleaner read is to normalize EBIT for non-recurring items before you trust the ratio at all.
The most useful interpretation pairs the ratio with cash. EBIT is an accrual figure; interest is paid in cash. When operating cash flow runs well below EBIT, year after year, the coverage ratio overstates the company's real ability to pay. Cross-checking the interest coverage ratio against a cash-flow-based version, where you use operating cash flow or EBITDA in the numerator, is the step that separates a surface reading from an analyst's read. The accounting profit covers the interest on paper; the question is whether the cash does too.
Interest coverage ratio vs the debt ratio: two different questions
The interest coverage ratio and the debt ratio both describe how a company uses debt, but they answer different questions and you need both. The debt ratio, total debt divided by total assets, measures how much of the company is financed by debt. It is a stock measure, a snapshot of the balance sheet at a point in time. It tells you the size of the obligation.
The interest coverage ratio is a flow measure. It tells you whether current earnings can carry the cost of that obligation right now. A company can carry a high debt ratio and still post strong coverage if its earnings are large and stable; another can carry modest debt and show weak coverage if its earnings are thin or collapsing. Reading them together gives you the full picture: the debt ratio sizes the load, and the interest coverage ratio tells you whether the engine is strong enough to pull it.
The limitations every reader of the ratio should hold in mind
The interest coverage ratio carries real limitations, and treating it as a verdict rather than an input is the common mistake. The number stays silent on several things that decide solvency:
- It uses EBIT, not cash, so the ratio can look healthy while cash generation is weak.
- It ignores principal entirely, so a company can cover interest comfortably and still face a refinancing wall it cannot clear.
- It says nothing about debt maturity, the mix of fixed and floating rates, or what happens to coverage if rates reset higher on variable debt.
It is also distorted by capitalized interest, which keeps part of the real interest burden off the expense line and flatters the denominator. And it is only as honest as the EBIT feeding it; aggressive accounting in the numerator produces a reassuring ratio over a fragile reality. None of this makes the metric weak. It makes it one reading among several. Used alongside cash flow coverage, the debt ratio, the maturity schedule, and the earnings trend, it earns its place. Used alone, it is a number that can be right for the wrong reasons.
FAQs
What is the interest coverage ratio in simple terms? It is the number of times a company's operating profit can cover its interest expense. You divide EBIT by interest expense for the same period, and a result of 4 means the business earned four times the operating profit it needed to pay its interest.
What is a good interest coverage ratio? A ratio above 2 is generally acceptable and above 3 is comfortable, while below 1.5 signals strain and below 1 means earnings do not cover interest at all. The right benchmark is industry-relative, because stable businesses can carry a lower ratio safely than cyclical ones can.
How do you calculate the interest coverage ratio? Divide earnings before interest and taxes, or EBIT, by the interest expense for the same period. Use matching periods, and use gross interest expense rather than interest net of interest income, so the denominator reflects the full cost of the debt.
What does the interest coverage ratio tell investors? It tells investors how much room a company has before financing costs threaten its profit and, eventually, its solvency. A high and stable ratio signals a manageable debt load; a falling ratio over several years signals erosion even when the current number still looks acceptable.
Is a higher interest coverage ratio always better? Higher coverage means a larger cushion, but an unusually high ratio paired with very low debt can also mean a company is under-using debt that could fund growth. The number should be read in context, against the industry, the trend, and the cash behind the earnings, rather than maximized for its own sake.
The short version
The interest coverage ratio is EBIT divided by interest expense, and it measures how comfortably operating earnings cover the cost of debt. A figure above 2 is generally acceptable, but the benchmark only holds for stable earnings. Read the trend across several years, normalize EBIT for one-time items, and cross-check the ratio against operating cash flow before you trust it. Paired with the debt ratio and the maturity schedule, it is a sharp tool for judging financial risk. Read alone, it is a single number that can look right while the balance sheet underneath it is tightening.
Worth the read?


