
Relative Strength Index — Read RSI With Context
Relative strength index shows momentum, not certainty. Learn how RSI works, what its signals mean, and where traders misuse it.
A relative strength index is a momentum oscillator that measures how quickly price has gained or lost ground over a recent lookback period. Traders use it to judge whether momentum is stretched, fading, or confirming the current structure. The mistake is treating RSI as a trade by itself.
RSI does not know where liquidity sits. It does not know whether price is trending, ranging, or reacting to a news-driven volatility spike. It only compresses recent gains and losses into a line between zero and 100. That line can help, but only when the trader reads it inside market context.
What the relative strength index tells you on a chart
The relative strength index indicator was developed by J. Welles Wilder Jr. and is usually plotted below price. The default setting is 14 periods. On a daily chart, that means 14 days. On a five-minute chart, that means 14 five-minute candles. The setting changes the sensitivity, not the core idea.
The indicator compares average gains with average losses over the selected period. When recent gains dominate, RSI rises. When recent losses dominate, RSI falls. A reading near 50 shows a more balanced tape. A reading above 70 is commonly called overbought. A reading below 30 is commonly called oversold.
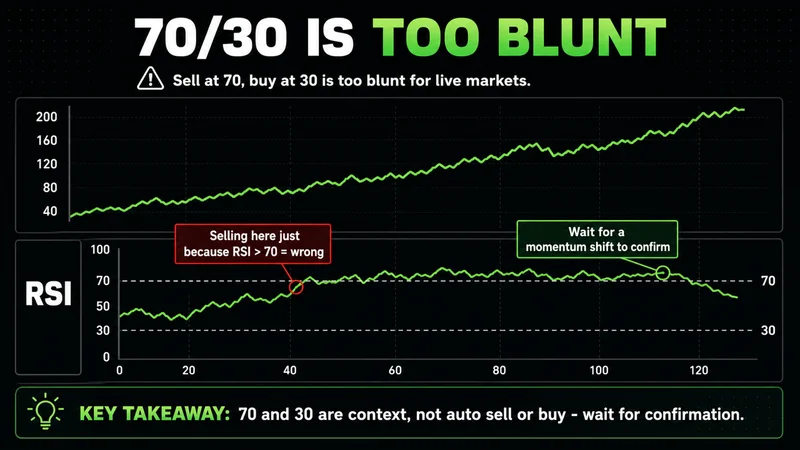
Those words cause problems. Overbought does not mean price must fall. Oversold does not mean price must bounce. In strong trends, RSI can stay extended while price keeps expanding. That is where beginners usually get trapped. They see a high RSI and short a strong market, or they see a low RSI and buy a clean downtrend.
The better question is simple: does RSI confirm the structure, or is it warning that momentum is no longer matching price?
How the relative strength index formula works
Most platforms calculate RSI automatically, but knowing the formula keeps the indicator from feeling more intelligent than it is.
RSI starts with relative strength, which is the average gain divided by the average loss over the lookback period. Wilder's common formula is:
| Step | Calculation | What it means |
|---|---|---|
| 1 | Average gain over the lookback | Measures recent upside pressure |
| 2 | Average loss over the lookback | Measures recent downside pressure |
| 3 | RS = average gain / average loss | Compares upside pressure with downside pressure |
| 4 | RSI = 100 - [100 / (1 + RS)] | Converts the ratio into a zero-to-100 oscillator |
That math matters because RSI is built from closing-price changes. It does not read volume, order flow, news, liquidity pools, or support and resistance. It is a momentum summary. If the recent closes have been strong, RSI rises. If recent closes have been weak, RSI falls.
This is why RSI should not be treated as hidden information. It is price behavior, smoothed and compressed into another format.
How to identify relative strength index on a chart
On most charting platforms, RSI appears in a separate panel below the main candlestick chart. The line usually moves between two horizontal levels: 70 and 30. Many platforms also show a centerline at 50.
The basic read is direct:
- RSI above 70 shows strong recent upside momentum.
- RSI below 30 shows strong recent downside momentum.
- RSI above 50 means average gains are stronger than average losses.
- RSI below 50 means average losses are stronger than average gains.
- RSI holding a range, such as 40 to 80 in an uptrend, can show trend strength.
That last point matters more than the textbook levels. In a strong bullish trend, RSI may pull back toward 40 or 50 and then rotate higher again. In a strong bearish trend, RSI may reject near 50 or 60 and continue lower. The market regime decides how useful the levels are.
Relative strength index trading signals need confirmation
The common relative strength index trading signal is simple: sell when RSI moves above 70, buy when RSI moves below 30. That version is too blunt for live markets.
A better process waits for confirmation. If RSI pushes above 70, the first read is not "short." The first read is that upside momentum is strong. A short idea only becomes reasonable if price reaches a meaningful level, fails to hold acceptance, and RSI starts to lose momentum while price stops expanding.
The same logic applies below 30. A low RSI tells you downside momentum has been aggressive. It does not tell you sellers are finished. A long idea needs a structural shift, such as a reclaim of a prior low, a failed breakdown, or a higher low forming after the flush.
RSI is useful when it confirms a trade idea that already has structure. It becomes dangerous when it replaces the structure.
This is where execution quality matters. The signal is not the entry. The signal is a prompt to inspect price behavior more closely.
Divergence is a warning, not a command
RSI divergence gets attention because it looks clean on a chart. Bullish divergence appears when price makes a lower low while RSI makes a higher low. Bearish divergence appears when price makes a higher high while RSI makes a lower high.
The logic is sound. Price is extending, but momentum is not confirming the extension. That can warn that the move is losing quality.
The problem is timing. Divergence can appear early and keep appearing while price continues in the same direction. In a strong trend, shorting every bearish divergence or buying every bullish divergence becomes expensive fast. The divergence tells you momentum is changing. It does not tell you when the market must reverse.
Use divergence as a caution flag. If you are already in a trade, it can tell you to tighten management or stop adding. If you are looking for a reversal, it can tell you to wait for price confirmation. It should not be used as an automatic entry.
Relative strength index confirmation before trading
Relative strength index confirmation starts with the chart before it starts with the indicator. The cleanest RSI reads happen when momentum, structure, and risk are aligned.
Use a simple confirmation sequence:
- Define the market condition first. Is price trending, ranging, or expanding after news?
- Mark the nearby liquidity and structure. Know where the prior highs, prior lows, and reclaim levels sit.
- Read RSI as momentum context. Ask whether the indicator supports the price structure or disagrees with it.
- Wait for price behavior. Look for acceptance, rejection, a failed breakout, or a reclaim.
- Define invalidation before entry. If the trade idea is wrong, the exit should already be obvious.
This process keeps RSI in the right role. It helps organize momentum, but it does not make the trade decision alone.
Most traders do not have an indicator problem. They have a context problem. They ask RSI to answer questions that only price structure, liquidity, and risk can answer.
Relative strength index vs money flow index explained
Relative strength index and money flow index are often compared because both oscillate between zero and 100 and both are used to identify stretched conditions. The difference is what they measure.
RSI uses price changes. Money Flow Index adds volume into the calculation. That means MFI tries to measure whether price movement is being supported by traded volume, while RSI only measures price momentum.
| Indicator | Main input | Common use | Main limitation |
|---|---|---|---|
| Relative strength index | Price momentum | Overbought, oversold, divergence, trend strength | Ignores volume and broader structure |
| Money flow index | Price and volume | Momentum with volume pressure | Volume data can be uneven across markets |
For liquid stocks and futures, MFI can add useful context when volume is clean. For markets where volume is fragmented or less reliable, RSI may be simpler and easier to compare across instruments. Neither one removes the need to read the chart.
Best timeframe for relative strength index
There is no best timeframe for relative strength index. There is only the timeframe that matches the decision you are making.
Day traders may use RSI on one-minute, five-minute, or 15-minute charts to read short-term momentum. Swing traders may use it on four-hour or daily charts. Position traders may care more about daily and weekly RSI because they are reading broader trend pressure.
The lower the timeframe, the more noise RSI produces. A five-minute RSI can flip quickly during lunch-session chop or around a fast liquidity sweep. A daily RSI moves more slowly, but it can be late for short-term execution. Faster is not better. Slower is not better. The timeframe has to match the trade horizon.
For most new traders, the practical starting point is to read RSI on the same timeframe used for structure, then check one higher timeframe for context. If the five-minute chart is the execution chart, the 15-minute or hourly chart can help show whether the lower-timeframe signal is fighting larger momentum.
Common relative strength index mistakes beginners make
The biggest RSI mistakes come from asking the indicator to remove uncertainty. It cannot do that.
The most common errors are predictable:
- Buying only because RSI is below 30. Oversold can become more oversold in a strong downtrend.
- Shorting only because RSI is above 70. Strong markets can stay overbought while price continues higher.
- Ignoring trend regime. The same RSI level means different things in a trend and in a range.
- Treating divergence as timing. Divergence warns that momentum is changing, but price still needs to confirm.
- Changing settings after every loss. Optimizing the period to recent price action usually creates hindsight comfort, not an edge.
- Using RSI without defined risk. The indicator does not replace invalidation, position sizing, or trade management.
These mistakes are not technical. They are execution mistakes. The trader wants certainty, so the indicator gets promoted from tool to decision-maker.
When RSI stops working
RSI performs poorly when market conditions shift faster than the indicator can summarize them. During major news, thin-liquidity sessions, or aggressive trend days, the line can stay extended for longer than a trader expects. A clean-looking oversold signal on NQ can keep sliding if sellers are still in control and liquidity below price has not been cleared.
It also struggles in messy ranges. Price can keep crossing the same levels, RSI can keep rotating through 30 and 70, and every signal looks valid until the next candle invalidates it. In that environment, the best decision may be to reduce frequency or wait for the range edge instead of reacting to every oscillator turn.
No strategy works in all market conditions. RSI is at its best when it supports a clear structural read. It is at its worst when the trader uses it to avoid making one.
Relative strength index checklist for new traders
Use this checklist before acting on RSI:
- Is the market trending, ranging, or reacting to a volatility event?
- Is RSI confirming the direction of price, or diverging from it?
- Is the signal happening near a meaningful level?
- Has price shown acceptance, rejection, reclaim, or displacement?
- Does the trade have defined invalidation?
- Is the position size small enough that one loss will not affect the next decision?
If those answers are unclear, the RSI reading is not enough. Waiting is part of the job. Professional trading often involves long periods of doing nothing, followed by short periods where execution has to be precise.
FAQs
What RSI number is bullish? A bullish RSI number depends on the market condition. In a strong uptrend, RSI holding above 40 or 50 and rotating higher can be more useful than a simple move above 70.
Can RSI be used alone? It can be used alone mechanically, but that is a weak process. RSI works better when combined with market structure, liquidity context, price confirmation, and defined risk.
The practical read
The relative strength index is useful because it organizes momentum into a simple visual read. It shows when recent buying or selling pressure has become stretched, when momentum is confirming the trend, and when price may be extending without the same force behind it.
The professional use is restrained. Read the market first. Use RSI second. If the indicator agrees with structure, it can improve timing and trade management. If it disagrees, treat it as information, not a command. Capital is protected by process, not by a line moving above or below a fixed level.
Worth the read?


