
Inverse Head and Shoulders Pattern — Trade the Shift
The inverse head and shoulders pattern can flag a bullish reversal. Learn how to read the neckline breakout, plan risk, and avoid false confirmations.
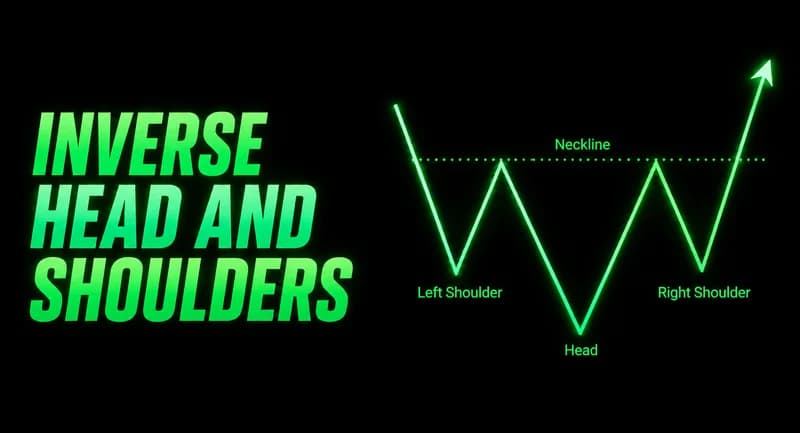
The inverse head and shoulders pattern is a potential bullish reversal after a downtrend, but the drawing is not the trade. The useful signal arrives when sellers fail to extend the decline and price proves that shift by reclaiming the neckline.
A clean pattern gives you a map. It does not remove uncertainty. The work is deciding whether the structure deserves risk, where the idea is invalidated, and whether the breakout has enough participation to matter.
Why the inverse head and shoulders pattern matters
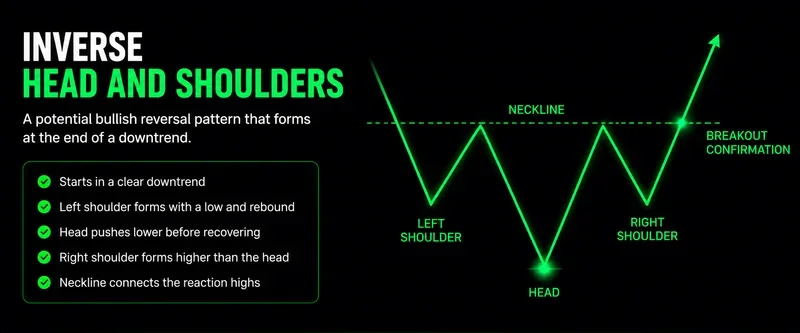
This pattern is useful because it turns a change in market behavior into a sequence you can inspect before committing capital:
Price starts from a clear downtrend, not a random sideways range.
The left shoulder marks an initial low and rebound.
The head pushes below that first low before recovering.
The right shoulder holds above the head, showing that sellers could not repeat the same damage.
The neckline connects the reaction highs and becomes the decision level.
The setup can appear in stocks, forex, commodities, indices, and crypto markets. The chart does not care which market you trade. The quality still depends on context, liquidity, and confirmation.
The three troughs show a loss of seller control
The left shoulder is not a reversal signal by itself. It is an ordinary bounce inside a bearish move. Price falls, finds temporary demand, and rebounds. At that point, sellers still have the benefit of the doubt.
The head is where the chart becomes more interesting. Price breaks the first trough and sets a lower low, which initially supports the bearish view. If that extension cannot hold and price recovers, the downside move starts to look less efficient.
The right shoulder is the test. Sellers get another chance to press the market lower, but the decline stalls above the head. That higher low is the evidence that supply is no longer landing with the same force.
The neckline joins the swing highs between those three troughs. Depending on the chart, it may be:
Horizontal.
Slightly rising.
Slightly falling.
All three variations can be valid. The important question is whether price can close through that resistance area and hold the reclaim.
A neckline breakout confirms the idea, not the outcome
A close above the neckline is the confirmation described by the pattern. It tells you the bearish sequence has changed. Momentum traders may enter, short sellers may exit, and fresh demand can add speed to the move.
That is still a probability, not a promise. This setup loses meaning when it forms without a prior downtrend, or when price pokes above the neckline and immediately falls back below it without participation. A breakout with no follow-through is information. Treat it as a failed test, not an invitation to widen risk.
Entry, target, and stop placement should agree
There are two practical entry styles. A breakout entry acts after price clears the neckline. A retest entry waits to see whether the old resistance area can hold as support. The breakout offers confirmation sooner. The retest may improve the risk-to-reward profile, but price will not always return to offer it.
Build the trade around one consistent plan:
For a breakout entry, act only after price closes through the neckline.
For a retest entry, wait for price to revisit the neckline and show that buyers still defend it.
For a projected target, measure the distance from the head low to the neckline and extend that distance above the breakout area.
For a tighter structural stop, place invalidation below the right shoulder.
For a wider stop, use the head low only when position size is reduced to keep risk controlled.
The projected target is a planning tool. It is not a guaranteed destination. If participation fades or the broader trend pushes back, manage the position based on what price is doing rather than what the measurement suggested.
Market psychology is visible in the failed pushes lower
The pattern matters because every segment carries information. Sellers control the original downtrend. Buyers interrupt that pressure at the left shoulder, but the first bounce is not enough to change the bias. Sellers return and create the head, which appears to confirm the bearish structure.
Then the market stops behaving like a healthy downtrend. The lower low recovers. The next selloff cannot reach the head. When price later moves above the neckline, the chart has recorded a progression from aggressive selling to failed continuation and then to buyer control.
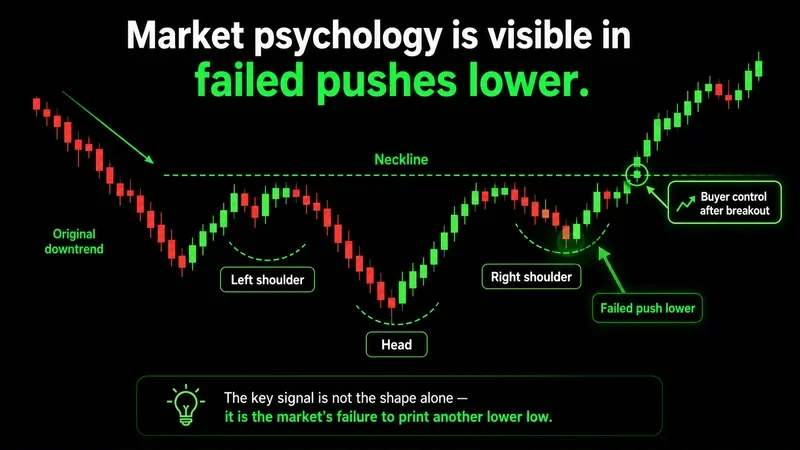
This is why the right shoulder deserves more attention than the silhouette. Traders often focus on whether the chart looks visually perfect. The more useful observation is that the market tried to resume the downtrend and could not print another lower low.
Common mistakes turn a clear setup into a poor trade
The pattern is easy to recognize after the move. Trading it in real time is harder because anticipation feels cheaper than confirmation.
Entering before the neckline breaks turns a reversal setup into a guess.
Ignoring the larger trend can leave you buying a weak bounce inside a stronger decline.
Treating volume as irrelevant can hide a breakout that lacks commitment.
Oversizing the position can make a normal pullback difficult to manage.
Volume is helpful, even though it is not mandatory. A decisive move through the neckline with stronger participation carries more weight than a thin push that stalls immediately. Higher timeframes also deserve respect because they usually contain more meaningful structure than a noisy intraday chart.
The pattern gives a plan, but it has limits
The inverse head and shoulders pattern has practical strengths:
The sequence is understandable once the shoulders, head, and neckline are marked.
Entry, invalidation, and target areas can be planned before execution.
The pattern can expose a possible bearish-to-bullish transition before a larger advance develops.
The same logic can be reviewed across multiple markets and timeframes.
Its limitations are just as important:
A false breakout can trigger an entry and reverse quickly.
Weak participation can produce a smaller move than the projected target.
News and market events can invalidate an otherwise clean setup.
The full structure may take several sessions to develop.
RSI divergence, volume, and nearby key levels can add context. None of them repairs a weak structure. If the right shoulder fails or the neckline reclaim cannot hold, the market has already answered the question.
FAQs
Is the inverse head and shoulders pattern bullish? It is generally treated as a bullish reversal pattern after a downtrend. The signal becomes more useful when price closes above the neckline.
Which timeframe works best for this pattern? The setup can appear on intraday, daily, weekly, and monthly charts. Higher timeframes often carry stronger signals, while lower timeframes may contain more noise.
Is volume required for confirmation? Volume is not mandatory, but it can improve confidence. A clean neckline break with visible participation is more persuasive than a weak move that stalls.
Can beginners trade the inverse head and shoulders pattern? Beginners can study and trade it, but waiting for a confirmed neckline breakout is more disciplined than entering early because the shape looks close enough.
How is an inverse head and shoulders pattern different from a double bottom? A double bottom has two similar troughs. An inverse head and shoulders pattern has three troughs, with the middle low forming the deeper head.
The real edge is waiting for proof
An inverse head and shoulders pattern is a planning framework for a possible bullish reversal. Mark the three troughs, define the neckline, wait for confirmation, and know where the idea fails before entering. The recognizable shape is useful. The discipline to demand proof is what keeps the setup tradable.
Worth the read?


