
Liquidity Sweep — How to Read It Before You Trade It
A liquidity sweep is a break that takes resting stop orders, then reverses. Learn to read the rejection, confirm it, and define risk before you trade.
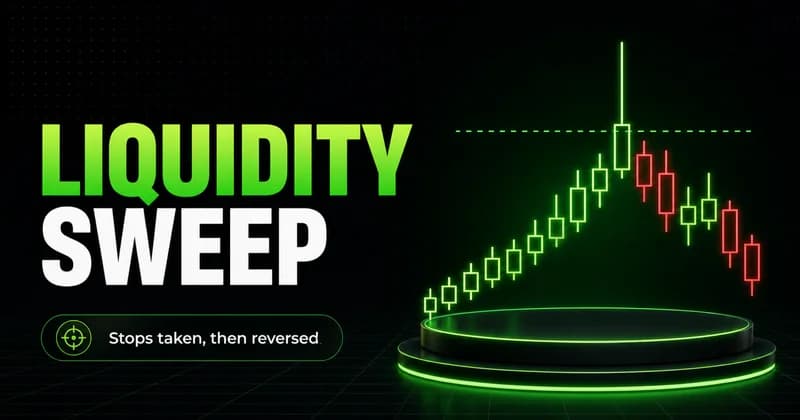
A liquidity sweep is a move that pushes price just past an obvious high or low to trigger the stop orders resting there, then rotates back the other way. The level breaks, the orders fill, and the continuation most traders expected never arrives. That reaction afterward is the part that matters. The sweep itself tells you almost nothing until you see what price does once the resting orders are gone.
Most traders read the break as a signal. They see price clear a prior high and assume the move is starting. A liquidity sweep is the market doing the opposite of what the break advertised, and the people who get hurt are usually the ones who entered on the break rather than on the response to it.
What a liquidity sweep actually means
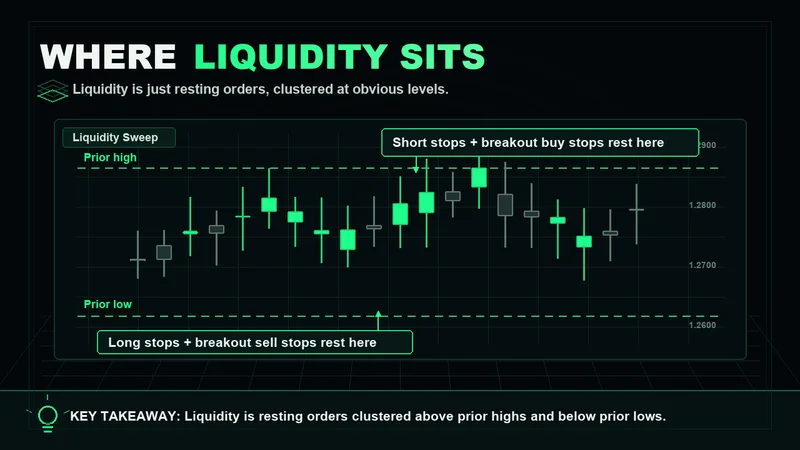
Liquidity is just resting orders. Above a prior high sit the stop losses of traders who are short, plus the buy stops of traders waiting to chase a breakout. Below a prior low sit the stops of traders who are long, plus the sell stops of breakout sellers. Those clusters are predictable because most charts draw the same obvious levels.
Larger participants need volume to fill size without moving price against themselves. The cleanest place to find that volume is exactly where the clustered orders sit. Price extends into the level, the resting orders fill, and the participant who needed the other side of the trade now has it. The move past the level was the mechanism, not the intention.
This is the liquidity sweep meaning in practice: the break exists to access orders, not to start a trend. Once you read it that way, the failed continuation stops looking like a surprise and starts looking like the expected outcome.
How a liquidity sweep forms on a chart
The pattern is consistent enough to describe. Price approaches a well-defined swing high or low that has held at least once before. It pushes through, often with a single extended candle or a quick spike. Then it fails to hold acceptance beyond the level and rotates back inside the prior range.
The rejection is the tell. A genuine breakout holds above the level and builds from there. A liquidity sweep trades through, takes the orders, and gives the level back. If price closes back inside the range after clearing it, the break did its job and the continuation buyers were never in control.
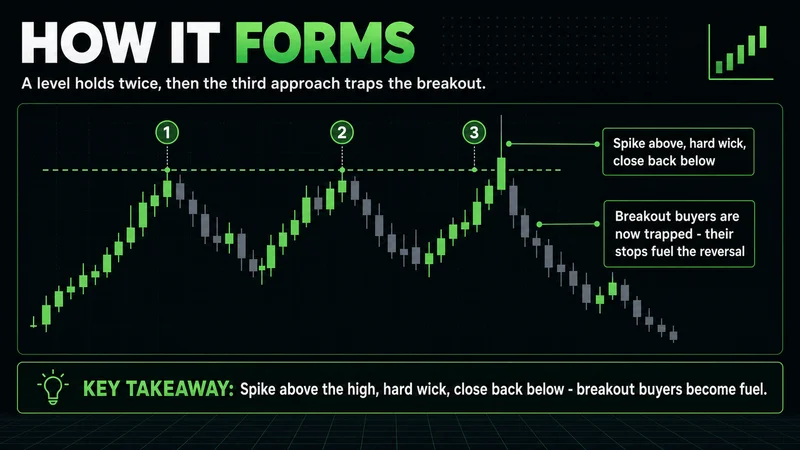
For a liquidity sweep chart example, picture a range that has held a high twice. On the third approach, price spikes a few ticks above the high, wicks hard, and closes back below it within a candle or two. The traders who bought the breakout are now offside, their stops become fuel for the move back down, and the rotation accelerates. That sequence is the entire idea.
How to identify a liquidity sweep before you act
Identification comes down to context first, then reaction. The level has to matter. A sweep of a random intraday wiggle means nothing; a sweep of a session high, a prior day's high or low, or a clear range boundary means something because that is where orders actually rest.
Here is what to look for when you want to know how to identify a liquidity sweep on a chart:
- A clean, obvious level that other traders are watching, not an arbitrary point.
- An extension through that level, often sharp, that fails to find follow-through.
- A close back inside the prior range, which signals the break was rejected.
- A shift in the immediate price behavior afterward, where the rotation moves with intent rather than drifting.
None of these confirm anything in isolation. The level gives you context, the failed extension gives you the event, and the rejection gives you the read. Skip the context step and you are guessing.
Liquidity sweep vs breakout — the distinction that costs money
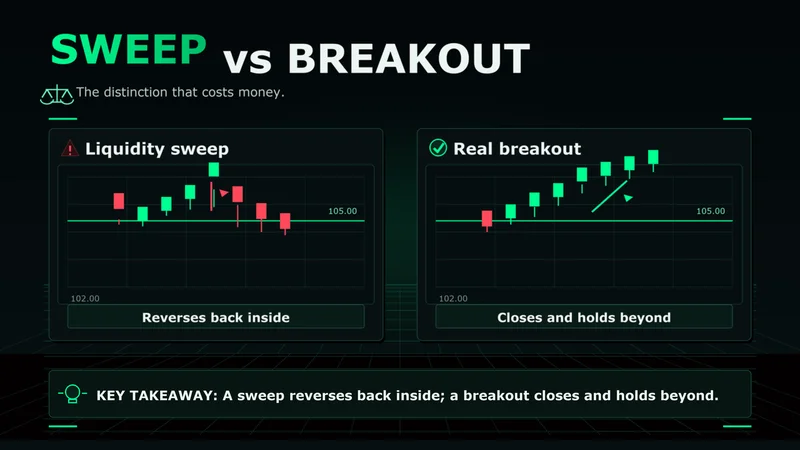
The difference between a liquidity sweep vs breakout is the single thing most traders get wrong, and it is worth drawing out plainly. Both start identically. Price clears a level. The chart looks the same in the moment. The separation only appears in what follows.
A breakout holds. Price clears the level, accepts above or below it, and builds structure in the direction of the break. A liquidity sweep clears the level, fails to hold, and reverses. The first is continuation; the second is a trap dressed as continuation.
The break tells you orders were taken. Only the reaction tells you who was in control.
This is why chasing the break is expensive. At the moment of the break you cannot know which one you are looking at. The trader who waits for acceptance or rejection has information the chaser does not. For a liquidity sweep vs breakout explained simply: the breakout earns the move, the sweep borrows it and gives it back.
How to confirm a liquidity sweep before entering a trade
Confirmation is where discipline separates a setup from a guess. A sweep on its own is an observation. It becomes tradable only when price confirms the rejection. Treat liquidity sweeps as a piece of confluence, not a standalone entry trigger.
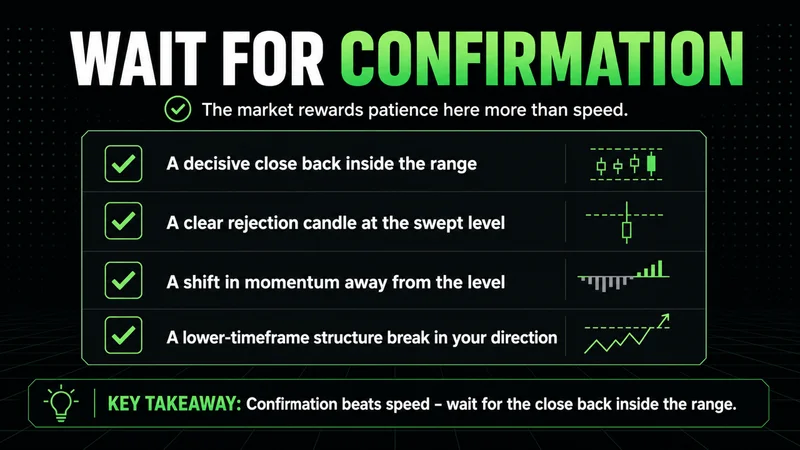
Waiting for confirmation is the part that protects capital. The market rewards patience here far more than speed. A liquidity sweep confirmation usually comes from one or more of the following:
- A decisive close back inside the range after the level is swept.
- A clear rejection candle at the swept level, showing the extension was refused.
- A shift in market structure on a lower timeframe in the direction of the rotation.
- Continuation away from the level rather than a slow drift that risks a second push through.
If you have a sweep at sellside liquidity below a low, the bias turns toward longs, but only after price confirms it cannot hold lower. If you have a sweep at buyside liquidity above a high, the bias turns toward shorts, again only after the rejection confirms. The bias is set by the sweep; the entry is set by the confirmation.
What timeframe to use for liquidity sweep analysis
The best timeframe for liquidity sweep analysis depends on the level you are reading, not on a fixed rule. Sweeps happen on every timeframe because resting orders exist on every timeframe. A daily high gets swept the same way a five-minute high does; the only difference is how much weight the level carries.
A practical approach reads the level on a higher timeframe and times the entry on a lower one. Mark the session high, the prior day's high or low, or a clear range on the higher chart. Then drop to a lower timeframe to read the rejection and confirmation with more precision. The liquidity sweep timeframe question is really a question of which level you trust, and higher-timeframe levels hold more orders, so their sweeps tend to mean more.
When the liquidity sweep read breaks down
This read works cleanly in liquid conditions during active sessions, where resting orders are dense and the rejection is real. It breaks down in thin or low-quality conditions. Overnight on light volume, or in a market grinding sideways with no clear participation, the same spike past a level can mean almost nothing. There were no real orders to take, so there is no real rejection to trade.
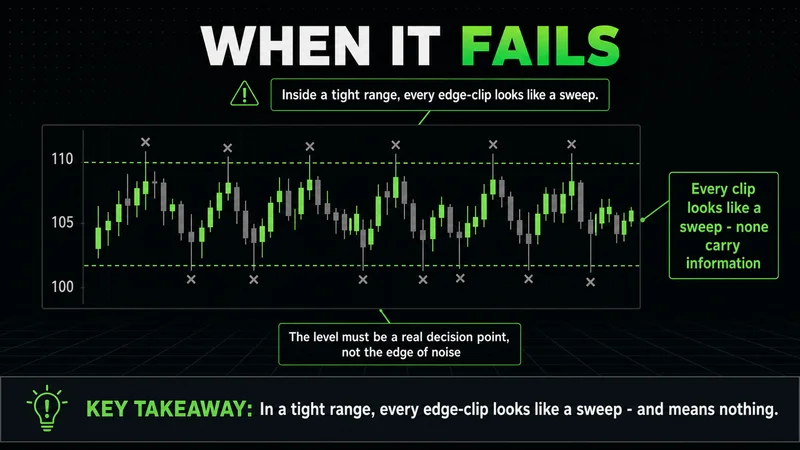
A ranging market is the other failure point. Inside a tight range, price clips both edges repeatedly, and every clip looks like a sweep. None of them carry information because the level is not a decision point; it is just the edge of noise. Forcing the read here turns a clean concept into a coin flip. Context decides whether a sweep is signal or noise, and without it you are trading without context, which is gambling with better vocabulary.
How a liquidity sweep should change your risk
The sweep gives you something concrete to define risk against, and that is its most useful trait. The extreme of the sweep is your invalidation. If you take the rotation after a high is swept, a reclaim of that high with acceptance says the read was wrong, and that is where the idea is invalidated.
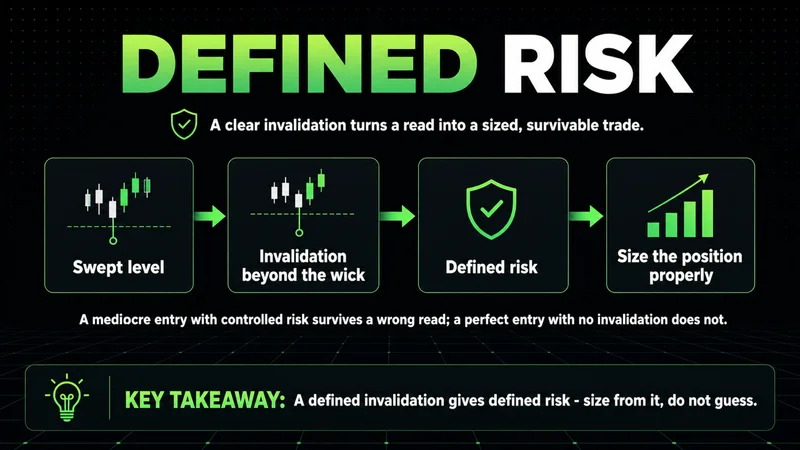
This matters because how a liquidity sweep affects trading risk is direct. A defined invalidation means defined risk, which means you can size the position properly instead of guessing. A mediocre entry with controlled risk survives a wrong read. A perfect-looking entry with no defined invalidation does not. Place the stop beyond the sweep extreme, size so a single loss is an operational cost rather than an emotional event, and let the structure tell you when you are wrong.
Common liquidity sweep mistakes beginners make
The liquidity sweep mistakes that cost the most are predictable. New traders see them because the concept is easy to learn and hard to apply under live conditions. Most of the damage comes from acting before the read is complete.
The recurring liquidity sweep mistakes look like this:
- Entering on the break itself instead of waiting for the rejection to confirm.
- Treating every spike past a level as a sweep, including the meaningless ones in a range.
- Ignoring context and trading sweeps of levels that hold no real orders.
- Trading sweeps in thin conditions where the rejection is not real.
- Skipping the defined invalidation, which leaves the position with undefined risk.
The common liquidity sweep mistakes beginners make share one root: impatience. The setup asks you to wait for confirmation, and waiting is the part that feels like inaction. It is the job.
A liquidity sweep checklist for new traders
A short liquidity sweep checklist keeps the read disciplined when price is moving fast and the temptation to chase is strongest. Run through it before you act, not after.
- Is the level a real one that other traders are watching, with orders likely resting there?
- Did price extend through the level and then fail to hold acceptance beyond it?
- Is there a clear rejection back inside the prior range?
- Do the conditions support the read, meaning a liquid, active market rather than a thin or ranging one?
- Is the invalidation defined at the sweep extreme, with a position size that keeps a single loss small?
If any answer is no, there is no trade. This liquidity sweep checklist for new traders is not about finding more setups; it is about refusing the low-quality ones that look the same in the moment but resolve very differently.
The short version
A liquidity sweep is a break that exists to take resting orders, not to start a trend, and the rejection afterward is the only part that carries information. Read the context first, wait for the confirmation, define risk against the sweep extreme, and skip the read entirely when conditions are thin or rangebound. The concept is simple. The discipline to wait for the rejection instead of chasing the break is the hard part, and it is also the part that separates a setup from a guess.
FAQs
What is a liquidity sweep in trading? It is a move where price pushes past a clear high or low to trigger the stop orders resting there, then rotates back the other way. The break exists to access liquidity, not to start a trend, and the rejection that follows is the part that matters.
How do you confirm a liquidity sweep before entering a trade? Wait for price to close back inside the prior range and show a clear rejection at the swept level. A sweep on its own is only an observation; it becomes tradable once the rejection confirms and structure shifts in the direction of the rotation.
What is the best timeframe for liquidity sweep analysis? There is no single best one, because sweeps happen on every timeframe. A practical approach reads the level on a higher timeframe, where more orders rest, and times the entry on a lower timeframe for precision.
Do liquidity sweeps work in ranging markets? Not reliably. Inside a tight range, price clips both edges repeatedly and every clip looks like a sweep, but none carry information because the level is just the edge of noise. The read needs a level that functions as a real decision point.
Worth the read?


