
Shooting Star Candlestick — Reading the Reversal
A shooting star is a bearish reversal candlestick. Learn how to identify it, confirm it, trade it with defined risk, and where the pattern fails.
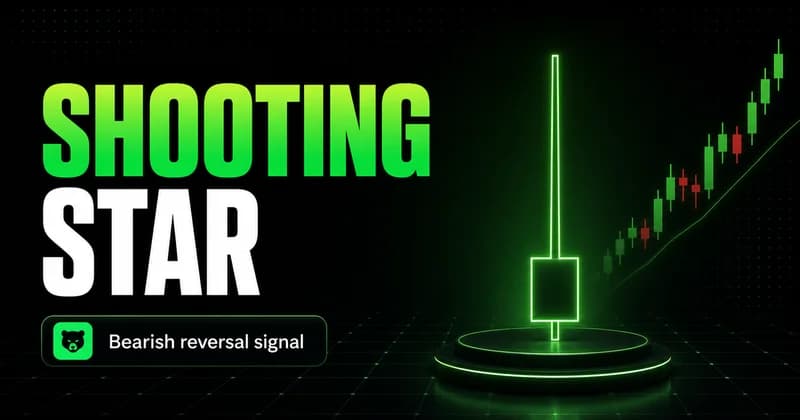
A shooting star is a single-candle bearish reversal signal: a small real body near the low of the range with a long upper shadow, printed after an extended push higher. It shows buyers drove price up during the session and sellers reclaimed almost all of that move before the close. The pattern marks a potential top, not a confirmed one. On its own it is a hint, and traders who act on the hint without confirmation or context lose money on it consistently.
The candle itself is easy to spot. What separates a useful shooting star from a decorative one is where it forms and what happens next. A shooting star at a tested resistance level after a strong run carries weight. The same shape in the middle of a range carries almost none. The shape is the alphabet. Location and confirmation are the language.
What a shooting star candlestick is
The shooting star meaning comes from the order flow it represents. Price opens, buyers extend it well above the open, and then sellers step in with enough force to push price back down to close near where it started. The long upper shadow is the record of that failed push. The small body near the low is the result.
That is why it reads as a warning at the top of an uptrend. The market just tried to continue higher and could not hold the gain. Buyers are losing control of the move, and if sellers follow through, the prior trend is in question. The candle does not predict the reversal. It documents the moment the buying pressure failed to stick.
Color matters less than beginners think. A red shooting star, where the close is below the open, is marginally stronger because the session ended net negative. A green one still qualifies as long as the body is small and sits near the low. The structure of the candle carries the signal, not the color.
How to identify a shooting star on a chart
To identify a shooting star, you are checking proportions and position, not just the silhouette.
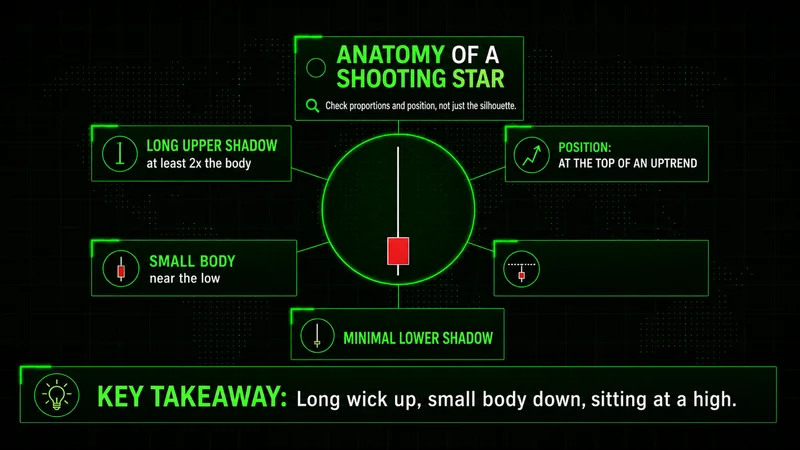
The criteria are specific:
- A prior uptrend. The candle has to come after a visible push higher. No uptrend, no reversal to signal.
- A long upper shadow. The upper wick should be at least twice the height of the real body. The longer the rejection, the clearer the failed push.
- A small real body near the low. Open and close sit close together and close to the session low.
- Little or no lower shadow. Price gave back nearly the entire move; it did not bounce off the low.
Miss the prior trend and you do not have a shooting star — you have a candle with a long wick that means nothing in isolation. The proportions are what most beginners get right and the location is what they ignore.
Shooting star vs inverted hammer
The shooting star vs inverted hammer comparison confuses people because the two candles look identical. Same small body, same long upper shadow, same minimal lower wick. The difference is entirely contextual: where the candle appears in the trend.
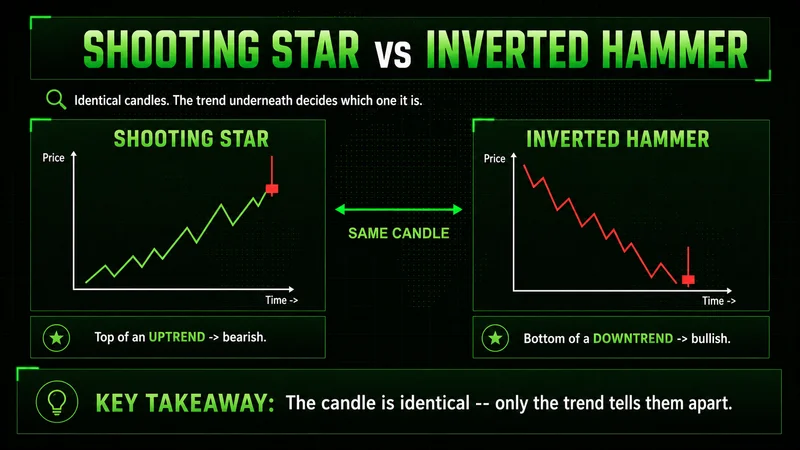
A shooting star prints at the top of an uptrend and warns of a bearish reversal. An inverted hammer prints at the bottom of a downtrend and hints at a bullish one. The candle is the same drawing. The trend it interrupts assigns the meaning.
| Shooting star | Inverted hammer | |
|---|---|---|
| Where it forms | Top of an uptrend | Bottom of a downtrend |
| Bias it signals | Bearish reversal | Bullish reversal |
| What it shows | Failed push higher, sellers reclaim | Probe higher, buyers test control |
| Confirmation | Bearish close below the body | Bullish close above the body |
This is the cleanest example of why candle shape alone is not a signal. Identify the trend first, then read the candle. Reverse that order and you will call every long-wicked candle a top.
Why location decides everything — a shooting star at resistance
A shooting star at resistance is worth acting on. A shooting star mid-range usually is not. Same candle, completely different value, and the difference is the level underneath it.
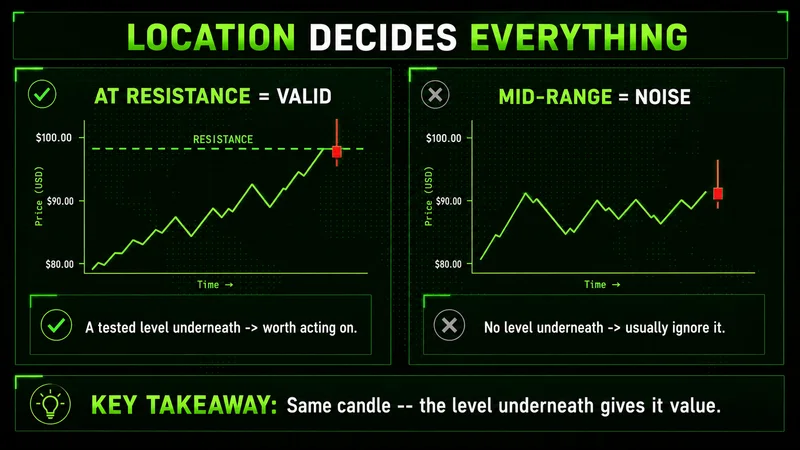
When price runs into a known resistance level — a prior high, a supply zone, the top of a range — and prints a shooting star there, the rejection lines up with a place other participants are also watching. The failed push is not random; it happened where sellers were waiting. That confluence is what gives the pattern an edge.
The same candle in the middle of a featureless range is noise. There is no level for it to reject, no prior trend for it to reverse, and no reason for the wick to mean anything beyond one session of indecision. Trading without context is gambling with better vocabulary, and a shooting star with no level beneath it is exactly that — a clean-looking candle attached to nothing.
How to confirm a shooting star before entering
Confirmation is the step that separates a setup from a guess. A shooting star confirmation is a follow-through candle that closes below the shooting star's body or low, showing sellers actually took control instead of buyers stepping back in.
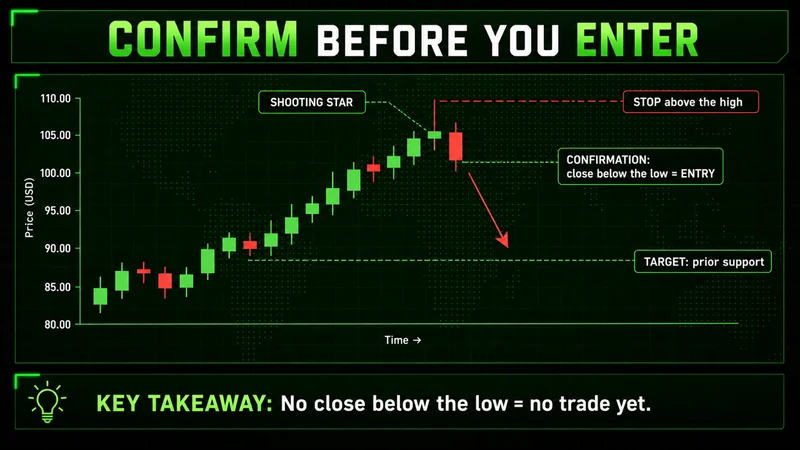
The sequence is simple and worth respecting:
- Wait for the close. A shooting star is only valid once the candle closes. Mid-candle, the wick can still fill in.
- Require a confirmation candle. The next candle should close below the star's body, ideally below its low.
- Define the stop. Risk sits above the shooting star's high — a close back above it means the signal failed.
- Set the target against structure. Prior support, a value area, or the next liquidity level gives a risk-defined objective.
The candle gives you the idea. The confirmation close gives you the trade. Acting between the two is just predicting, and the market does not pay for predictions.
Confluence sharpens the read. A shooting star that prints on elevated volume tells you the failed push happened with real participation behind it, not on a thin trickle of orders. An overbought momentum reading or a rejection at a level that has already turned price before adds weight in the same way. None of these are required, and none of them replace the confirmation close, but each one raises the quality of the setup from acceptable to high-probability.
This is also where timeframe matters. A shooting star on a 4-hour or daily chart, where each candle reflects real participation, is more reliable than one on a 1-minute chart, where a single wick means little. Higher timeframes filter out the noise that produces false stars.
Trading the shooting star — a risk-defined approach
The shooting star trading strategy that survives contact with live markets is built around confirmation and defined risk, not the candle alone. A practical checklist:
- Confirm the context. Extended uptrend into a tested resistance level — not mid-range.
- Validate the candle. Long upper shadow at least twice the body, small body near the low, minimal lower wick.
- Wait for the confirmation close below the star's body before committing.
- Place the stop above the high and size the position so that stop is a small, planned loss.
- Target real structure — prior support or the next level, with a reward that justifies the risk.
- Skip it if any piece is missing. A shooting star without a level, or without confirmation, is not a trade.
Notice the entry comes last. The work is in the context and the risk, not the candle. A mediocre entry with proper risk control survives; a perfect-looking shooting star with no stop discipline eventually does damage.
Where the shooting star fails
The pattern breaks down in two conditions worth naming, because both cost beginners money.
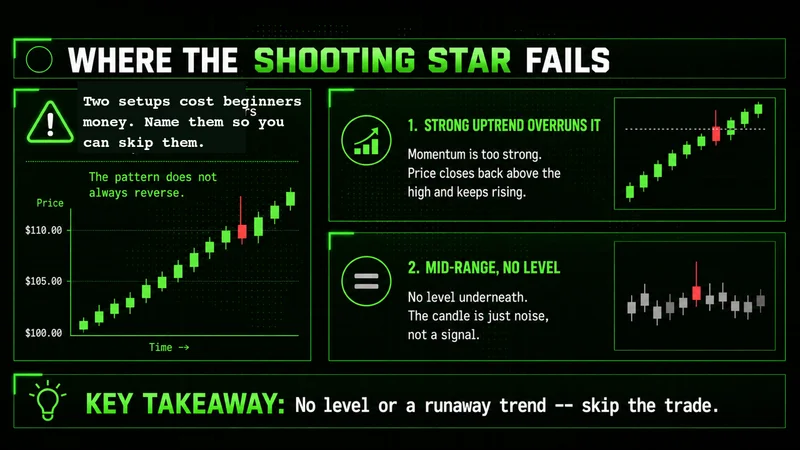
The first is a strong trend. Inside a powerful uptrend, a single shooting star is often just a pause. Price digests, then continues higher, closing back above the star's high and running the stops of everyone who shorted the wick. A reversal candle against a dominant trend is the lowest-probability version of the pattern. The trend has to be showing other signs of exhaustion before one candle means anything.
The second is thin liquidity. On low-volume overnight sessions, a long upper wick can form on a handful of contracts and reverse on just as few. The candle looks identical to a high-conviction daytime rejection but reflects almost no real participation. The same shooting star that reads cleanly during cash hours can be meaningless at 3 a.m. on a quiet tape. Confirmation and context are the only defense, and in thin conditions even confirmation is suspect.
This is the honest limit of the pattern. It is a probability tool, not a prediction, and it performs worst exactly when a trader most wants a top to be in.
Common shooting star mistakes beginners make
Most losses on this pattern come from a short, repeatable list of errors:
- Trading the candle without a level. A shooting star mid-range is noise, not a signal.
- Skipping confirmation. Shorting the wick before the next candle closes is predicting, not reacting.
- Fighting a strong trend. One reversal candle rarely stops a powerful move.
- Ignoring timeframe and liquidity. A 1-minute star on a thin overnight tape is not the same as a daily star at resistance.
- No defined stop. Without risk above the high, a failed signal turns into an oversized loss.
None of these are exotic. They are the predictable result of treating a candle shape as a complete decision instead of one input inside a structural read. Fix the context and the risk first, and the pattern starts doing the job it was built for.
FAQs
What is a shooting star candlestick in trading? It is a single-candle bearish reversal pattern with a small real body near the low and a long upper shadow, forming after an uptrend. It shows buyers pushed price higher during the session and sellers reclaimed almost the entire move by the close.
How do I identify a shooting star? Look for four things: a prior uptrend, an upper shadow at least twice the body, a small body near the session low, and little or no lower shadow. Without the prior uptrend, the candle is not a shooting star.
What is the difference between a shooting star and an inverted hammer? The candles look identical. A shooting star forms at the top of an uptrend and signals a bearish reversal; an inverted hammer forms at the bottom of a downtrend and signals a bullish one. Trend context assigns the meaning.
How do I confirm a shooting star before trading it? Wait for the candle to close, then require a confirmation candle that closes below the star's body or low. Place the stop above the star's high and target prior structure. No confirmation close means no trade.
Does a shooting star work on every timeframe? No. It is more reliable on higher timeframes like the 4-hour, daily, and weekly, where each candle reflects real participation. On low timeframes and thin overnight liquidity, the same shape produces frequent false signals.
Worth the read?


