
Price to Earnings Ratio — What It Measures
The price to earnings ratio is the price you pay for one dollar of a company's earnings. Here is what it measures, how to read it, and where it breaks.

The price to earnings ratio is the price you pay for one dollar of a company's annual earnings. You calculate it by dividing the share price by earnings per share, and the result tells you how many years of current profit the market is willing to pay for up front. A stock at a P/E of 20 costs 20 times what the business earns in a year. That single number is useful, but it is not a verdict. It is a question about expectations, and the answer depends on context most people skip.
Most traders treat the P/E as a price tag: low is cheap, high is expensive. That framing is where the mistakes start. A low ratio can mean the market expects earnings to fall. A high ratio can be justified when growth is real and durable. The number is reactive to two moving parts at once, and reading it without knowing which part is moving is closer to guessing than analysis.
What the price to earnings ratio actually measures
The price to earnings ratio measures expectation, not value. It compares what the market is paying today against the profit a company is producing today. When the ratio is high, the market is paying for earnings it expects to arrive later. When it is low, the market is either discounting future earnings or pricing in a decline.
This is the part the standard definition leaves out. Two stocks can both trade at a P/E of 15 and mean completely different things. One might be a stable business with flat earnings. The other might be a company whose profits are about to collapse, where the price has already dropped but earnings have not caught up yet. The ratio is identical. The situation is not.
The P/E is a relationship between two numbers, and both of them move. Price moves every second. Earnings move every quarter. Reading the ratio means knowing which side is driving the change before you draw any conclusion from it.
The price to earnings ratio formula and how to calculate it
The price to earnings ratio formula is straightforward:
P/E ratio = Share price / Earnings per share (EPS)
Earnings per share is the company's net income divided by the number of outstanding shares. So the full calculation runs in two steps:
Find earnings per share: net income divided by shares outstanding.
Divide the current share price by that earnings-per-share figure.
There are two common versions of the input. Trailing P/E uses the past 12 months of reported earnings, which are real but backward-looking. Forward P/E uses analyst estimates for the next 12 months, which are timely but unproven. Trailing tells you what happened. Forward tells you what the market is betting on. Neither is more correct; they answer different questions, and mixing them up is a frequent source of confusion.
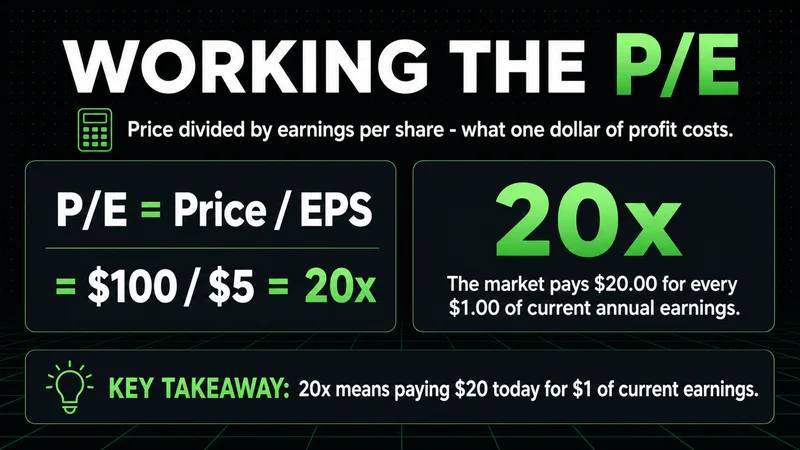
A worked price to earnings ratio example
Consider a company trading at 100 dollars per share. Over the past year it earned 5 dollars per share. The price to earnings ratio is 100 divided by 5, which equals 20. The market is paying 20 dollars for every dollar of current annual earnings.
Now change one input. Suppose the share price stays at 100, but earnings per share rises to 8. The ratio falls to 12.5. The stock did not get cheaper because the price dropped; it got cheaper because the business earned more. That distinction matters. A falling P/E driven by rising earnings is a different signal than a falling P/E driven by a dropping price.
Run it the other way. If earnings fall to 2 dollars per share while the price holds at 100, the ratio jumps to 50. Nothing about the stock improved. The denominator shrank. A ratio can climb for the worst possible reason, and the headline number gives no hint of which case you are looking at.
How to interpret the price to earnings ratio
Interpretation is where the ratio earns its keep or misleads you. A high P/E means the market expects earnings growth. A low P/E means the market expects little growth, or expects a decline. The ratio is the market's collective bet expressed as a multiple.
The useful question is never "is this number high or low" in the abstract. It is "high or low relative to what." Relative to the company's own history. Relative to its direct competitors. Relative to the broader market. A P/E of 30 is rich for a utility and ordinary for a fast-growing software company. The same number carries opposite meanings depending on what surrounds it.
This is where a lot of beginner analysis goes wrong. Trading without context is gambling with better vocabulary. A P/E read in isolation, with no sense of the industry, the growth rate, or where the business sits in its cycle, is just a number wearing the costume of analysis. Context is the work. The ratio is only the prompt.
What is a good price to earnings ratio and the benchmark question
There is no universal good price to earnings ratio. The benchmark depends entirely on the comparison set. A reasonable benchmark is the average P/E of companies in the same industry, because businesses with similar economics tend to trade in similar ranges.
A few reference points help frame the comparison:
Mature, slow-growth sectors like utilities or consumer staples often trade at lower multiples, because earnings are stable but not expanding fast.
High-growth sectors like technology often trade at higher multiples, because the market is paying for future earnings, not just current ones.
The broad market has historically averaged somewhere in the mid-teens to low-twenties over long stretches, though that figure drifts with interest rates and sentiment.
The benchmark is a relative tool. A stock at a P/E of 12 in an industry averaging 25 looks cheap. The same stock at 12 in an industry averaging 8 looks expensive. The absolute number tells you almost nothing on its own.
Price to earnings ratio vs price to book ratio
The price to earnings ratio and the price to book ratio answer different questions, and using the right one depends on the kind of business you are analyzing.
The P/E ratio measures price against earnings, so it works best for profitable companies with stable, recurring income. The price to book ratio measures price against the company's net assets on the balance sheet, so it works better for asset-heavy businesses such as banks, insurers, and industrials, where book value is a meaningful anchor.
Metric | Compares price to | Best suited for | Breaks down when |
|---|---|---|---|
Price to earnings (P/E) | Annual earnings | Profitable, steady-income firms | Earnings are negative or volatile |
Price to book (P/B) | Net asset (book) value | Asset-heavy firms like banks | Most value is intangible, not on the balance sheet |
For a software company whose value lives in code, brand, and people rather than physical assets, book value understates reality and the P/B ratio reads as misleadingly high. For a bank, the P/E can swing wildly with loan-loss provisions while book value stays steadier. The metrics are not rivals. They are different lenses, and the business tells you which lens to reach for.
When the price to earnings ratio quietly breaks down
The ratio reads cleanly when a company has stable, positive earnings. Outside that condition, it can fail without warning. This is the part most explainers underplay.
When earnings are negative, the P/E is meaningless. You cannot divide a price by a loss and get a usable multiple, so the ratio is simply not reported, and a metric that disappears exactly when a company is struggling is not the metric to lean on in that moment. When earnings are distorted by a one-off event, a legal settlement, an asset sale, a tax change, the denominator no longer reflects the underlying business, and the ratio inherits the distortion.
Cyclical companies are the sharpest example. A steel producer or an automaker at the top of its cycle shows peak earnings, which pushes the P/E down and makes the stock look cheap precisely when it is most expensive. At the bottom of the cycle, earnings collapse, the P/E spikes, and the stock looks expensive right when value is building. For cyclicals, the ratio inverts the signal you actually want. The number behaves, but it points the wrong way.
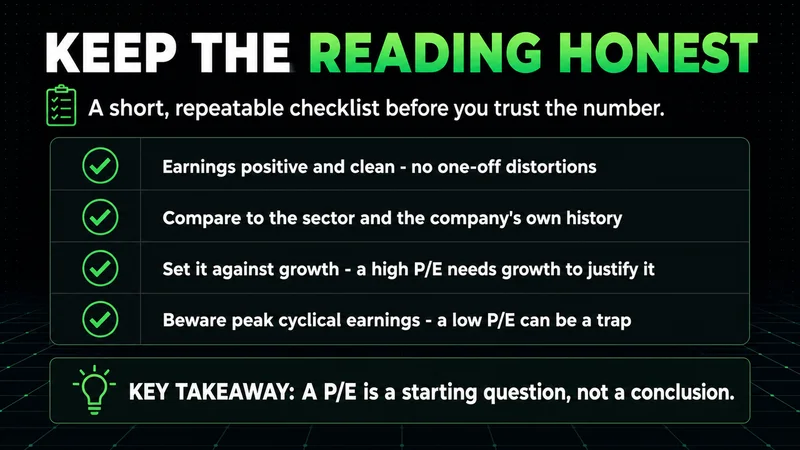
How to use the price to earnings ratio in stock analysis
Used correctly, the price to earnings ratio is a starting point, not a conclusion. It frames a question that the rest of your analysis has to answer. A short, repeatable checklist keeps the reading honest:
Confirm earnings are positive and not distorted by a one-time item.
Compare the ratio to the company's own history and to its direct competitors, not to the market as a whole.
Check whether you are looking at trailing or forward earnings, and do not mix the two.
Ask what growth rate the multiple implies, then ask whether that growth is realistic.
Cross-check with a second metric suited to the business, such as price to book for asset-heavy firms.
The ratio works best as one input among several. It tells you what the market expects. Your job is to decide whether that expectation is reasonable, and that decision needs more than one number. A clean process beats a single clever metric every time.
FAQs
What is the price to earnings ratio in simple terms? It is the share price divided by earnings per share. The result shows how much investors are paying for each dollar of a company's annual earnings, expressed as a multiple. A P/E of 20 means the market is paying 20 dollars for every dollar the business currently earns in a year.
How do you calculate the price to earnings ratio? Divide the current share price by earnings per share. Earnings per share is net income divided by shares outstanding. So a stock at 100 dollars with earnings of 5 dollars per share has a P/E of 20.
What is a good price to earnings ratio? There is no single good number. A reasonable P/E depends on the industry, the company's growth rate, and where it sits in its cycle. The useful comparison is against direct competitors and the company's own history, not an absolute threshold.
What does a high price to earnings ratio mean? A high ratio means the market expects strong future earnings growth and is paying for it in advance. It can be justified when that growth is real and durable. It becomes a risk when the expected growth fails to arrive.
What is the difference between trailing and forward P/E? Trailing P/E uses the past 12 months of reported earnings, which are real but backward-looking. Forward P/E uses analyst estimates for the next 12 months, which are timely but unproven. They answer different questions and should not be mixed.
When is the price to earnings ratio not useful? When earnings are negative, distorted by a one-off event, or driven by a business cycle. For cyclical companies, the ratio can look lowest at the peak and highest at the trough, inverting the signal you actually want.
Related reading
The price to earnings ratio is one lens among several. To build a fuller view of a stock's valuation, read it alongside the price to book ratio for asset-heavy businesses, earnings per share for the quality of the denominator itself, and the broader set of market value ratios that put price in context. No single multiple decides a thesis; the ratios work as a set.
Worth the read?


