
Annual Report Analysis — Reading a Company Honestly
Annual report analysis means reading the numbers before the narrative, weighting the financial statements over the marketing, and finding where they disagree.
Annual report analysis is the process of reading a company's yearly disclosure to judge how the business actually performed, where the money came from and went, and whether the narrative management tells matches the numbers underneath it. Done well, it is less about admiring growth and more about finding the places where the story and the figures quietly disagree. That gap is where the useful information lives.
Most people open an annual report and read the part that was written to be read: the chairman's letter, the glossy highlights, the photographs of factories and smiling staff. That section exists to frame your interpretation before you reach the statements. The disciplined order is the reverse. Start with the numbers, form your own read, then go back to the narrative and check whether management is describing the same company you just saw in the financials.
What annual report analysis actually means
The annual report analysis meaning is straightforward once you separate the document from the exercise. The annual report is the artifact a company publishes once a year. The analysis is what you do with it: a structured reading that turns a few hundred pages of disclosure into a judgment about financial health, durability, and risk.
A company is required to tell you certain things. It is not required to make them easy to find or comfortable to read. Analysis is the work of pulling the load-bearing facts out of a document that is part legal filing, part marketing, and part accounting. The skill is knowing which pages carry weight and which pages are decoration.
The goal is not a verdict of good or bad. It is a clear-eyed picture of how the business makes money, how stable that process is, what could break it, and whether the people running it are being candid about all three.
The components of an annual report and what each one is for
Understanding the annual report analysis components matters because each section answers a different question, and reading them in the wrong order lets the company set your expectations first.
- Letter to shareholders. Management's framing of the year. Useful for tone and strategy, but written to persuade. Read it last.
- Management discussion and analysis (MD&A). Where leadership explains the results in their own words. The most revealing section when you read it against the financials rather than instead of them.
- The three financial statements. The income statement, the balance sheet, and the cash flow statement. This is the core of any serious reading.
- Notes to the financial statements. The footnotes. Often where the real story is buried, because anything awkward tends to be disclosed here in dense language.
- Auditor's report. A short section confirming whether an independent auditor signed off and whether they raised any qualifications. Brief, but you read every word.
The first half of most reports is narrative. The second half is the financials and the notes. Weight your attention toward the second half, then use the first half as a cross-check.
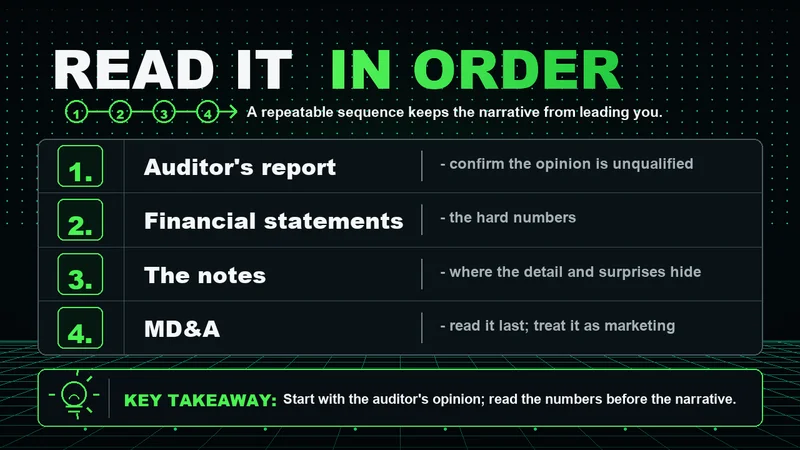
How to read an annual report analysis step by step
A repeatable sequence keeps you from being led by the narrative. The same order works whether you are screening one company or comparing several.
- Read the auditor's report first. Confirm the opinion is unqualified. A qualified opinion or a going-concern note reframes everything that follows.
- Move to the cash flow statement. Cash is harder to manufacture than reported earnings. Check whether operating cash flow tracks net income over several years or drifts away from it.
- Read the income statement across years, not in isolation. Look at revenue trend, gross margin, and operating margin. A single year tells you almost nothing; the direction over three to five years tells you a lot.
- Work through the balance sheet. Look at the debt load, how it is structured, and whether assets are real and productive or inflated by goodwill and intangibles.
- Read the notes. Revenue recognition, debt covenants, related-party transactions, contingencies. This is where the awkward facts live.
- Finish with the MD&A and the shareholder letter. Now you can judge whether management is describing the business you just analyzed or a more flattering one.
The order is the point. Numbers first, narrative last. If you read the letter first, you will spend the rest of the report looking for evidence that confirms it.
The interpretation that separates reading from analyzing
The annual report analysis interpretation step is where most readers stop too early. Pulling figures off a page is data entry. Interpretation is asking what the figures imply about durability and risk.
Revenue growth means little without knowing where it came from. Growth funded by genuine demand is different from growth funded by acquisitions, extended payment terms, or one-time items. Rising profit with falling operating cash flow is a signal worth a second look, because earnings can be shaped by accounting choices while cash is comparatively stubborn.
Margins tell you about pricing power and cost control. A margin that erodes year after year while revenue climbs often means the company is buying growth rather than earning it. Context decides whether that is a temporary investment phase or a structural problem.
A company does not have to lie to mislead you. It only has to choose which true facts to put in front of you first.
The interpretation should always include the conditions that would make your read wrong. If your thesis is that margins are recovering, name the line item that would prove you wrong if it moved the other way next year. Analysis without a defined invalidation is just an opinion wearing a suit.
A worked annual report analysis example
An annual report analysis example makes the sequence concrete. Picture a company reporting record revenue and record net income, with a confident shareholder letter about momentum and market share.
You start with cash flow. Operating cash flow has been flat for three years while reported net income has climbed steadily. That divergence is the first thing to explain, not ignore. Moving to the balance sheet, accounts receivable have grown faster than revenue, which suggests the company is booking sales it has not yet collected. The notes reveal a change in revenue recognition timing in the period the gap widened.
None of this proves wrongdoing. It might be an aggressive but defensible accounting choice, or a one-time shift in customer payment behavior. The point of the example is the order of operations. The numbers raised the question, the notes supplied the context, and the shareholder letter, read last, never mentioned any of it. That silence is itself a data point.
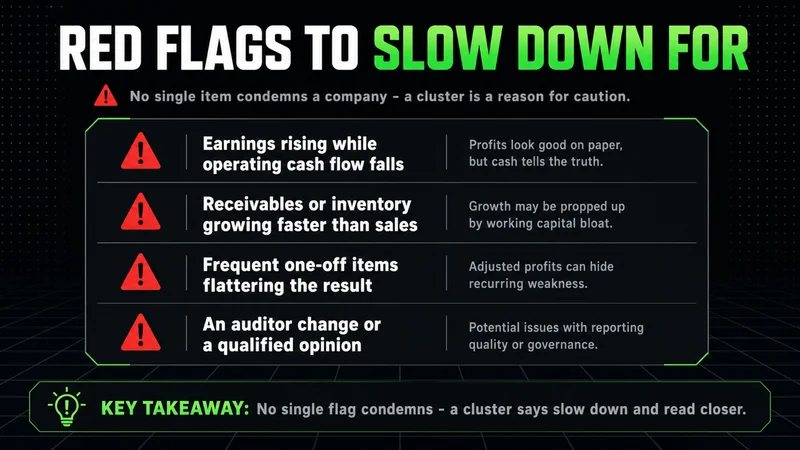
Annual report analysis red flags worth slowing down for
No single item below condemns a company. Each is a reason to read more carefully, and a cluster of them is a reason to be cautious. These are the common annual report analysis red flags that reward attention.
- Earnings rising while operating cash flow stalls or falls. The most common early warning that reported profit is being shaped by something other than the underlying business.
- Receivables or inventory growing faster than revenue. Sales may be booked before they convert to cash, or product may be piling up unsold.
- A qualified or heavily caveated auditor's opinion. Rare, and serious when present.
- Heavy reliance on adjusted or non-standard metrics. When management leads with custom figures and downplays the standard ones, ask what the standard numbers show.
- Frequent restatements or accounting-policy changes. A moving measurement makes year-over-year comparison unreliable.
- Related-party transactions buried in the notes. Money moving between the company and its insiders deserves a clear explanation.
The formula is consistency. A single red flag with a clear explanation in the notes is often fine. The same flag, unexplained, alongside two others, is a pattern.
Is there an annual report analysis formula?
Readers often look for an annual report analysis formula, a single equation that produces a verdict. There isn't one, and treating ratios as a formula is where a lot of analysis goes wrong. What exists is a small set of ratios that turn raw statement figures into comparable measures.
- Profitability: net margin and operating margin show how much of each dollar of revenue survives as profit.
- Debt load: the debt-to-equity ratio shows how much of the business is financed by borrowing versus owners' capital.
- Liquidity: the current ratio shows whether short-term assets cover short-term obligations.
- Returns: return on equity shows how efficiently the company turns shareholder capital into profit.
These ratios are tools, not decision-makers. A debt-to-equity ratio of two means one thing for a utility with stable cash flows and something very different for a cyclical manufacturer. The ratio gives you the question; context gives you the answer.
Annual report analysis vs financial statement analysis
The distinction in annual report analysis vs financial statement analysis is one of scope. Financial statement analysis works only with the three statements and the notes, treating them as a self-contained dataset. Annual report analysis is broader. It includes the statements but also reads the MD&A, the strategy, the risk disclosures, and the gap between what management says and what the figures show.
Financial statement analysis tells you what the numbers are. Annual report analysis adds whether you believe the people presenting them and whether the surrounding narrative holds up. A company can have clean statements and a strategy section full of warning signs, and only the wider reading catches that.
For a long-term investor, the wider reading is usually the right tool. For a quick comparison across many companies, the narrower statement analysis is faster. The two are layers of the same exercise, not competitors.
How annual report analysis fits a trader's context, not just an investor's thesis
Most guides frame this as a long-term investing task, and for buy-and-hold work it is. The less obvious use is as a context layer for shorter-term decisions. You do not trade an annual report. You trade price. But knowing a company carries heavy near-term debt maturities, or that its margins are thinning, changes how you read its price behavior around earnings and macro events.
This is where the wider reading earns its place even for someone who holds for days rather than years. A name with a fragile balance sheet behaves differently under stress than a name with a fortress one. The report does not give you an entry. It tells you which side of a volatile move is more likely to be the painful one to be caught on.
This only holds up to a point. In a liquidity-driven selloff, strong and weak balance sheets often get sold together, and fundamentals stop sorting names the way they do in calmer conditions. The report's edge as a sorting tool fades exactly when correlation spikes. Treat it as context that improves your odds in normal conditions, not a shield that works in every regime.
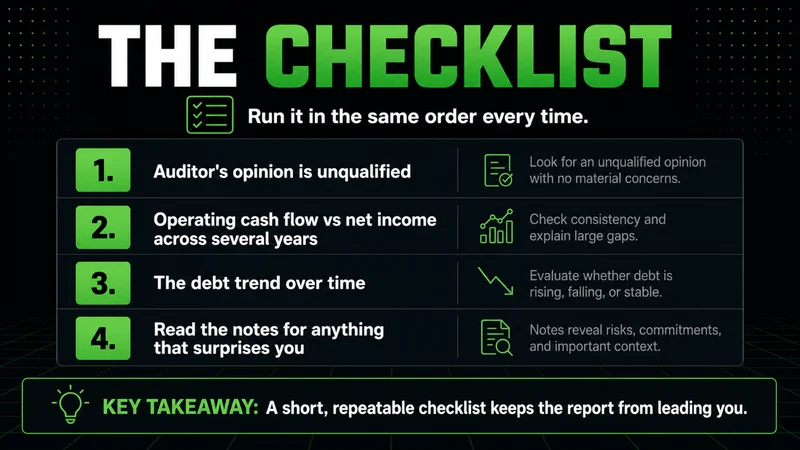
An annual report analysis checklist for beginners
A short, repeatable annual report analysis checklist keeps the process disciplined when the document tries to lead you. Run it in this order every time.
- Confirm the auditor's opinion is unqualified.
- Compare operating cash flow to net income across several years.
- Read the income statement as a multi-year trend, not a single snapshot.
- Check the debt load and maturity profile on the balance sheet.
- Read the notes for revenue recognition, contingencies, and related-party items.
- Read the MD&A and shareholder letter last, and check them against your own read.
The checklist is deliberately boring. Discipline in the order is what protects you from being framed by the narrative, and the boring sequence is what makes the reading repeatable across dozens of companies.
FAQs
What is annual report analysis in simple terms? It is reading a company's yearly report to judge how the business actually performed and whether management's story matches the financial numbers. The aim is a clear picture of financial health and risk, not a quick verdict.
What should I look for in annual report analysis first? Start with the auditor's report and the cash flow statement, not the shareholder letter. Cash is harder to manipulate than reported earnings, and the auditor's opinion frames how much you can trust everything else.
What are the most important annual report analysis components? The three financial statements and the notes carry the most weight. The MD&A and shareholder letter matter mainly as a cross-check, read after you have formed your own view from the numbers.
What are the common annual report analysis red flags? Earnings rising while operating cash flow stalls, receivables growing faster than revenue, heavy use of adjusted metrics, and frequent accounting changes. One alone is rarely decisive; a cluster is a reason for real caution.
How is annual report analysis different from financial statement analysis? Financial statement analysis works only with the statements and notes. Annual report analysis is broader, adding the strategy, risk disclosures, and the gap between management's narrative and the figures.
Is there a single annual report analysis formula? No. A small set of ratios such as net margin, debt-to-equity, the current ratio, and return on equity turn raw figures into comparable measures, but each only means something in context. The ratio gives you the question, not the answer.
The short version
Annual report analysis comes down to a disciplined order and an honest comparison. Read the numbers before the narrative, weight the financial statements and notes over the marketing, and treat the gap between the story and the figures as the most useful thing in the document. The ratios and red flags are tools for finding that gap, not a formula that decides for you. Done consistently, the process turns a long, persuasive document into a clear read on how a business actually works and where it could break.
Worth the read?


