
Bullish Engulfing — What the Pattern Actually Tells You
A bullish engulfing is a two-candle reversal signal — but it only means something when location, timeframe, and follow-through agree with it.
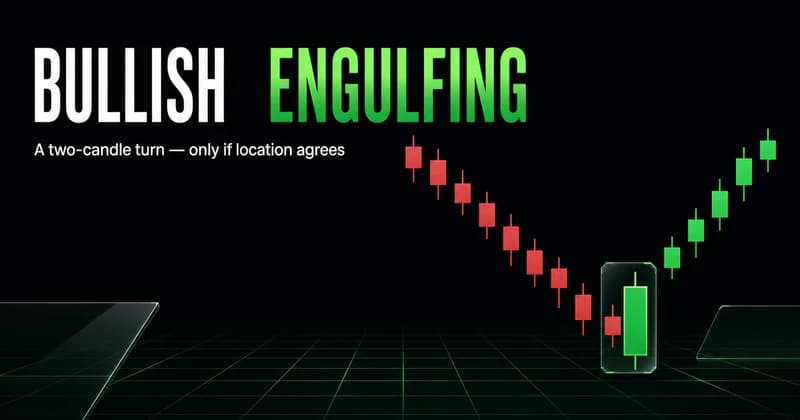
A bullish engulfing is a two-candle reversal signal where a larger up candle fully covers the prior down candle's body, marking a shift from sellers to buyers near the end of a decline. That is the textbook definition. The part most explanations skip is that the pattern only means something when the location and the follow-through agree with it. A bullish engulfing in the middle of nowhere is just two candles.
The shape is easy to memorize and easy to misread. Beginners learn to spot the formation, then trade every instance they find, and the results scatter because the candle was never the edge. Context was. This guide treats the bullish engulfing as evidence, not a trigger, and walks through how to read it the way someone reads it after watching thousands of these print in live conditions.
Bullish engulfing meaning, stated plainly
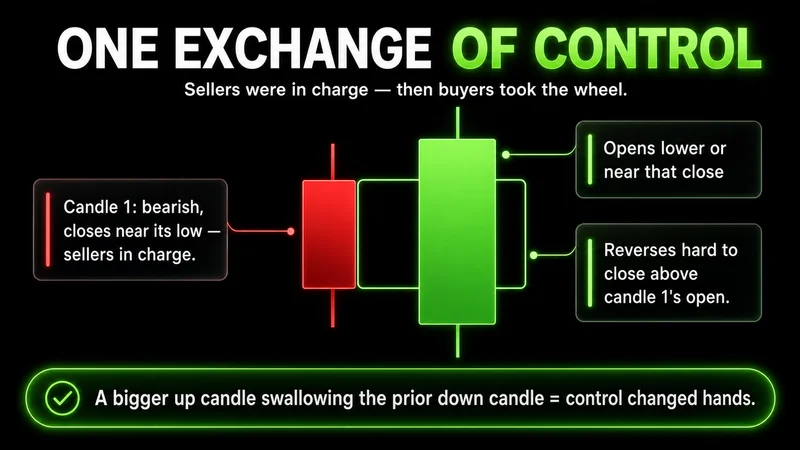
The bullish engulfing meaning comes down to one exchange of control. The first candle is bearish and closes near its low, which tells you sellers were still in charge. The second candle opens lower or near that close, then reverses hard enough to close above the first candle's open. Its real body engulfs the prior real body completely.
Wicks are secondary. Some definitions demand the second candle engulf the wicks too; in practice, the body-over-body relationship carries the signal. What matters is the message: sellers pushed, buyers absorbed the push, and buyers closed the period in control.
That is the whole story the pattern tells on its own. It does not tell you the trend has reversed. It tells you that, over two periods, the balance of pressure flipped. Whether that flip survives the next several candles is a separate question, and it is the one that decides whether the setup was worth anything.
How to identify a bullish engulfing on a chart
The checklist for how to identify a bullish engulfing on a chart is short, and keeping it short is the point.
- The first candle is bearish (close below open).
- The second candle is bullish (close above open).
- The second candle's body opens at or below the first candle's close and closes at or above the first candle's open.
- The formation sits after a visible move down, not inside a sideways chop.
That fourth condition is the one beginners drop. A bullish engulfing example for beginner traders almost always shows the pattern at the bottom of a clean decline, because that is where it reads cleanly. On a real chart, you have to decide whether the prior move down was meaningful or just noise. If you cannot point to the down move it is supposedly reversing, the pattern has nothing to reverse.
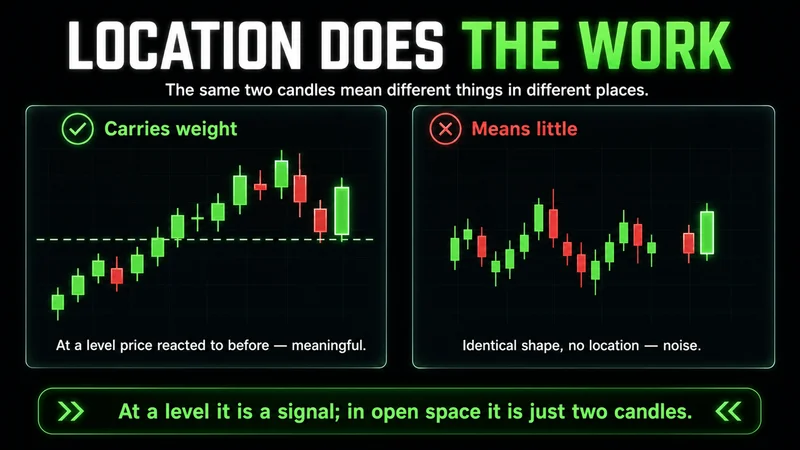
Location does most of the work. The same two candles printing at prior support, at a higher low in an uptrend, or into a level where price has reacted before carry far more weight than an identical formation floating in open space.
What a bullish engulfing pattern signals about pressure
The bullish engulfing pattern signals a change in who is willing to pay up. Read it as order flow, not as a promise. Sellers were active into the first candle. On the second candle, enough buying arrived to absorb that supply and then push price through it. The wider the engulfing body relative to recent candles, the more decisive that absorption was.
This is why a bullish engulfing reversal signal is stronger when it appears with expansion. Two formations that both fit the definition can carry very different weight:
- A small body that barely covers the prior candle shows a narrow win for buyers.
- A large body that closes near its high, on a candle noticeably bigger than the surrounding range, shows buyers took control and held it into the close.
The second case is the one worth respecting.
Volume adds confirmation when you have it. Higher participation on the engulfing candle means the absorption was real rather than a thin-market drift. On instruments without reliable volume, the size and close location of the candle carry that weight instead.
How to confirm a bullish engulfing before entering a trade
Confirmation is where most of the edge lives, and it is the step beginners skip in their hurry to be early. Knowing how to confirm a bullish engulfing before entering a trade is more useful than knowing how to spot one.
There are three common ways to wait for it:
- Hold above the engulfing high. Wait for the next candle to trade and hold above the high of the engulfing candle. This filters out formations that immediately fail.
- Reclaim and acceptance. Look for price to accept above the level the engulfing candle reclaimed, rather than poking through and falling back. Acceptance means price spends time there, not a single wick.
- Confluence with structure. The cleanest entries come when the pattern lines up with a support level, a prior higher low, or a tested level. Confirmation and confluence are not the same thing; the strongest setups have both.
Waiting costs you a slightly worse entry price. It buys you a much higher base rate. The trade-off favors patience for almost everyone who is not running a tested, high-frequency system.
Bullish engulfing vs bearish engulfing, explained
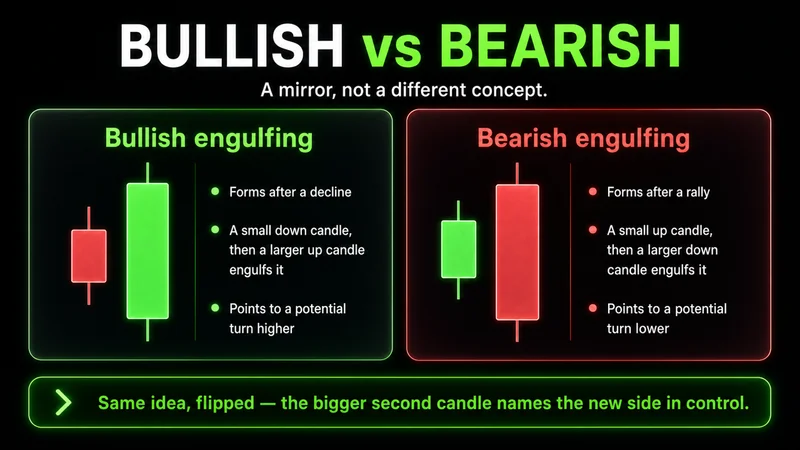
The bullish engulfing vs bearish engulfing distinction is a mirror, not a different concept. A bullish engulfing forms after a decline: a small down candle, then a larger up candle that engulfs it, pointing to a potential turn higher. A bearish engulfing forms after an advance: a small up candle, then a larger down candle that engulfs it, pointing to a potential turn lower.
The logic is symmetric. In both cases, the second candle shows one side overwhelming the other over two periods. The difference is direction and the move that precedes it. A bullish engulfing read in the wrong context, such as after an extended rally, is not a reversal signal at all; it is just an up candle, and the pattern's name does not change what price is actually doing.
This is the most common labeling error. Traders see the two-candle shape and apply the bullish reading regardless of where it sits. The preceding trend is part of the pattern, not optional background.
What is the best timeframe for bullish engulfing analysis
There is no single best timeframe for bullish engulfing analysis, but higher timeframes produce more reliable signals. A bullish engulfing on a daily or four-hour chart represents a full session or several hours of repositioning. The same pattern on a one-minute chart can form and invalidate inside a few minutes, often on noise.
The pattern is the same shape on every timeframe. What changes is how much conviction sits behind each candle. On the daily, a lot. On the one-minute during a quiet hour, almost none.
This is where the pattern breaks down, and it is worth naming plainly. Structure reads cleanly in regular cash-session hours when participation is broad. The identical engulfing candle printed overnight on thin liquidity, on futures or a low-volume name, often means almost nothing because a few orders can manufacture the shape without any real shift in pressure. The formation looks the same; the conviction behind it does not exist. Match the timeframe and the session to how much weight you are about to put on the signal.
Common bullish engulfing mistakes beginners make
Most common bullish engulfing mistakes beginners make trace back to treating the candle as the entire decision.
- Trading it without context. A pattern with no preceding down move has nothing to reverse. Trading without context is gambling with better vocabulary; entries only matter when they align with structure and conditions.
- Skipping confirmation. Entering on the close of the engulfing candle, before any follow-through, exposes you to every immediate failure.
- Ignoring the level. The same formation at support and in open space are not the same trade, even though the candles look identical.
- Oversizing because the candle looks strong. A convincing candle is not a reason to risk more. The pattern can still fail, and position size should reflect that.
- Forcing it on low timeframes. Hunting the pattern on one-minute charts produces a stream of signals, most of which are noise.
None of these are analysis problems. They are discipline problems, and they are why two traders can run the same pattern and get opposite results.
How a bullish engulfing affects trading risk and sizing
The practical value of the pattern is that it hands you a defined invalidation, which is what makes how a bullish engulfing affects trading risk a concrete question rather than an abstract one. The low of the engulfing candle is a natural line. If price closes back below it, the reversal premise is gone and the trade is wrong.
That structure lets you size the position from risk rather than from conviction. The sequence is short:
- Mark the invalidation at the engulfing candle's low.
- Measure the distance from your entry to that level.
- Decide what fraction of capital you are willing to lose if the trade is wrong.
- Let those two numbers set the position size.
A modest entry with risk sized correctly will outlast a sharp entry sized on conviction. The candle never improves the odds enough to justify skipping that math.
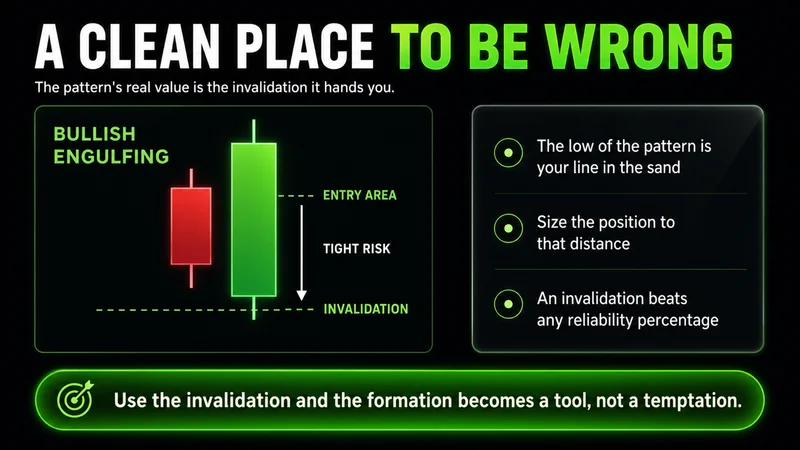
The candle does not improve your odds enough to justify abandoning that math. It gives you a clean place to be wrong, which is more useful than any reliability percentage you will read about the pattern. Use the invalidation, size to it, and the formation becomes a tool instead of a temptation.
A bullish engulfing checklist for new traders
This bullish engulfing checklist for new traders compresses the article into something you can run before risking anything.
- Is there a clear down move for the pattern to reverse?
- Does the second candle's body fully engulf the first candle's body?
- Is the engulfing candle expansive, closing near its high?
- Does the formation sit at or near a meaningful level?
- Has price confirmed by holding above the engulfing high?
- Is the timeframe high enough that each candle carries real conviction?
- Is the session liquid enough that the candles reflect genuine pressure?
- Is your invalidation defined, with size set from that risk?
If the answer to any of the first seven is no, the setup is weaker than it looks. If the answer to the eighth is no, it is not a trade yet.
FAQs
What is bullish engulfing in trading? It is a two-candle reversal pattern where a larger bullish candle completely engulfs the body of the prior bearish candle after a decline. It signals that buyers have taken control of pressure over those two periods, though it needs confirmation and context to be tradable.
What does a bullish engulfing pattern mean? It means sellers were in control on the first candle, and buyers absorbed that selling and closed in control on the second. The bullish engulfing meaning is a shift in pressure, not a guarantee that the trend has turned.
Is a bullish engulfing a reliable reversal signal? It is more reliable when it forms at a meaningful level, on a higher timeframe, with an expansive candle and follow-through. In isolation, with none of that context, it is close to a coin flip.
How do you confirm a bullish engulfing before entering? Wait for price to hold above the high of the engulfing candle, look for acceptance above the reclaimed level rather than a single wick, and favor formations that align with support or structure.
What is the difference between bullish and bearish engulfing? They are mirror images. A bullish engulfing forms after a decline and points higher; a bearish engulfing forms after an advance and points lower. The preceding move is part of the read in both cases.
What timeframe works best for bullish engulfing analysis? Higher timeframes such as daily and four-hour produce more reliable signals because each candle reflects more participation. Low timeframes generate frequent formations that are mostly noise.
Why do bullish engulfing patterns fail? They fail most often when traded without context, without confirmation, on low timeframes, or during thin liquidity where the candles can be manufactured by a handful of orders rather than a real shift in pressure.
What the bullish engulfing is good for, and what it isn't
The bullish engulfing is a clean piece of evidence: over two periods, buyers took control from sellers. That is genuinely useful. It gives you a readable shift in pressure and, just as valuable, a defined invalidation to build risk around.
What it is not is a standalone signal. The formation only earns its reputation when location, timeframe, liquidity, and follow-through line up behind it. Strip those away and you are left with two candles that happen to fit a shape. Read the context first, let the pattern confirm what the context already suggests, size the trade from the invalidation, and the bullish engulfing becomes one of the more honest tools on the chart.
Worth the read?


