
Deflation — What It Is and How Traders Read It
Deflation is a sustained fall in prices. Here is what it means, how it is calculated, and how traders read deflation data for context and positioning.
Deflation is a sustained drop in the general price level, the point where the inflation rate falls below zero and money buys more over time rather than less. That sounds harmless on the surface. In practice, broad and persistent deflation is one of the harder conditions a market can price, because falling prices change how households, businesses, and debt all behave at once.
Most coverage treats deflation as a textbook definition and stops there. A trader has to go further. The number itself matters less than what it tells you about demand, positioning, and the policy response that tends to follow.
What deflation actually means
The deflation meaning is narrow and specific. Prices across the economy fall, measured by an index such as the Consumer Price Index, and the year-over-year change reads negative. A single soft print is not deflation. The condition is defined by persistence, not by one month.
This is where most readers get tripped up. Deflation is not the same as disinflation. Disinflation is inflation slowing down while staying positive: prices still rise, just less quickly. Deflation is the level moving the other way. Confusing the two leads to bad conclusions about what the data is saying.
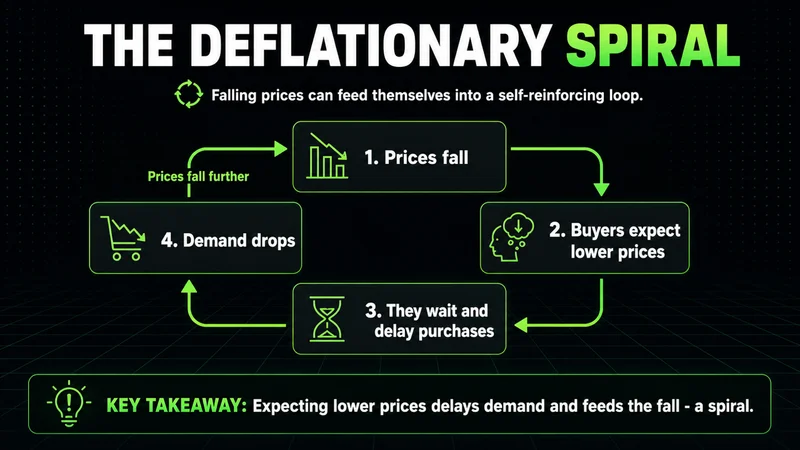
Deflation also tends to feed itself. When buyers expect prices to be lower next quarter, some of them wait. That delay pulls demand forward into the future and out of the present, which pushes prices down further. Economists call the self-reinforcing version a deflationary spiral, and it is the part that worries central banks far more than the first negative print.
How deflation is calculated
The deflation calculation uses the same machinery as inflation, run in the opposite direction. You take a price index for two periods and measure the percentage change. When that change is negative, the period shows deflation.
The core steps are straightforward:
Pick a price index, most often the Consumer Price Index, which tracks a fixed basket of goods and services.
Record the index level for the current period and the comparison period, usually the same month a year earlier.
Subtract the earlier level from the current one, divide by the earlier level, and express the result as a percentage.
A negative percentage is the deflation rate for that period.
The choice of index changes the picture. Headline measures include food and energy, which swing hard. Core measures strip those out to show the underlying trend. As a deflation economic indicator, the core reading usually carries more signal, because a one-month collapse in energy prices can drag the headline negative without telling you anything durable about demand.
Why deflation matters for investors
Deflation reshapes the relationship between cash, debt, and assets. Cash gains real value as prices fall, which sounds good until you remember that most of the economy runs on borrowing. Debt is fixed in nominal terms. When prices and wages fall, that debt becomes heavier to carry in real terms, and the burden lands on borrowers, companies, and governments alike.
The effects tend to cluster:
Real debt burdens rise, because loans are repaid in money that is now worth more.
Corporate revenue and margins compress when selling prices fall faster than costs.
Spending and investment slow as buyers and firms wait for lower prices.
Savers and holders of cash gain purchasing power, at least until employment weakens.
For deflation impact on stocks, the read is rarely clean. Equities generally dislike broad deflation because it signals weak demand and shrinking nominal earnings. But the response is uneven. Companies with pricing power and little debt hold up better than highly leveraged, low-margin names. The index level can mask wide dispersion underneath.
How traders use deflation data
This is the angle the encyclopedic explainers skip. A deflation print is not a trade by itself. It is context that shifts the probability around other setups.
When a deflation report lands, the cleaner information is usually in the reaction, not the headline. Price often moves on the gap between the print and what was already positioned for. A negative number that the market expected can produce almost no movement. A surprise in either direction is where the volatility shows up.
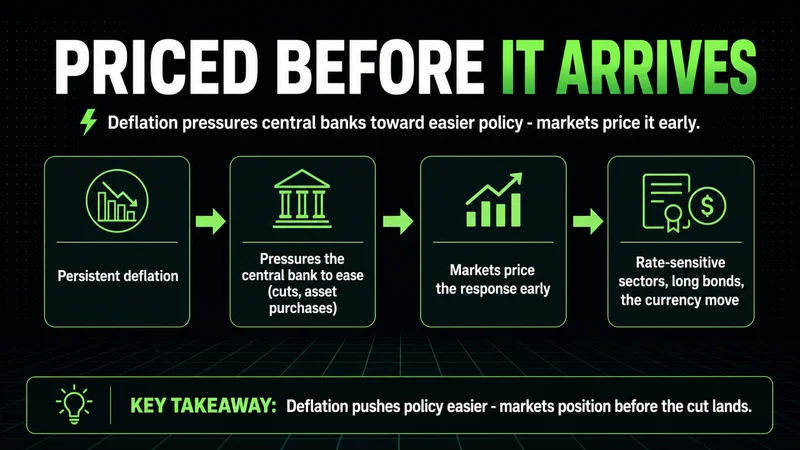
The practical use of a deflation trading signal is anticipatory. Persistent deflation pressures central banks toward easier policy: rate cuts, asset purchases, or both. Markets tend to price that response before it arrives. Rate-sensitive sectors, long-duration bonds, and the currency all carry part of that expectation. Reading deflation data well means tracking what it implies for the next policy move, not just what it says about last month's prices.
The market does not care about opinions or conviction. Risk exists whether you acknowledge it or not, and a single macro print rarely justifies sizing up. The deflation number sharpens the backdrop; it does not replace the structure and liquidity you were already trading.
Where reading deflation data breaks down
This framework holds in normal conditions, where one data series moves at a time and the market has room to digest it. It breaks down fast around major macro events. During a liquidity shock or a coordinated policy surprise, a deflation print can be completely overridden by flows that have nothing to do with the price level. The same number that would move a quiet tape means almost nothing when positioning is already being forced.
The two most common misreads compound the problem. The first is treating one soft month as deflation when it is really disinflation or noise. The second is overreacting to a single headline figure while ignoring the core trend and the policy context around it. Both come from reading the deflation limitations out of the data instead of into it.
Deflation, in summary
Deflation is a sustained, economy-wide fall in prices, and it carries more weight than its quiet definition suggests. The mechanics are the inflation calculation in reverse; the consequences run through debt, demand, and policy. For a trader, the value is in context and reaction, not in the headline number. Separate deflation from disinflation, watch the core trend over single prints, and respect the conditions where the read stops working. The data describes the environment. Execution still decides the outcome.
FAQs
What is deflation in simple terms? It is a sustained fall in the general price level across an economy, the point where the inflation rate turns negative and the same amount of money buys more over time. It is defined by persistence, not by one weak month.
What is the difference between deflation and disinflation? Disinflation is inflation slowing down while staying positive, so prices still rise, just more slowly. Deflation is the price level actually falling. The two point to very different demand conditions, and confusing them leads to bad conclusions about the data.
How does deflation affect the stock market? Broad deflation usually pressures equities because it signals weak demand and shrinking nominal earnings. The effect is uneven: companies with pricing power and low debt tend to hold up better than highly leveraged, low-margin names, so the index level can hide wide dispersion underneath.
Worth the read?


