Best Time Frame for Trading — How to Actually Choose One
The best time frame for trading is set by your hold time, screen time, and risk tolerance, not by the chart that prints the most signals.
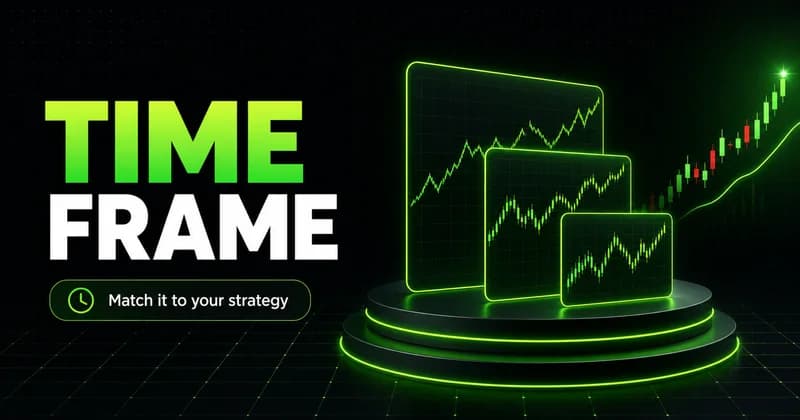
The best time frame for trading is the one that matches your strategy, your available screen time, and the risk you can actually hold without flinching. There is no universal winner. A five-minute chart is right for one trader and wrong for the next, and the difference is rarely the chart itself. It is the process built around it.
Most traders ask the question backward. They look for the time frame that produces the most signals, then try to bend their schedule and risk around it. That order is the problem. The time frame is a consequence of how you trade, not the starting point.
What the best time frame for trading really means
A time frame is simply how much price each candle represents. A one-minute candle closes every minute. A daily candle closes once per session. The chart does not change the market; it changes how much detail you see and how much noise you absorb.
The trade-off between lower and higher time frames is consistent:
- Lower time frames show more activity, more signals, and more noise. They reward fast execution and punish hesitation.
- Higher time frames smooth that noise into cleaner structure, but each decision carries more weight and takes longer to confirm.
- The same market move looks like a trend on one chart and a single candle on another. Neither view is more correct; they answer different questions.
So the "best" time frame is not a fixed number. It is the resolution at which you can read market structure clearly, define risk precisely, and execute without second-guessing every wick.
Match the time frame to your strategy, not the other way around
Your strategy already implies a time frame. A momentum trader who needs to be flat by the close cannot operate from a weekly chart. A position trader holding for weeks gains nothing from a one-minute candle.
Start with the trade you actually want to take, and let these questions set the chart:
- How long do you intend to hold the position?
- Where does the idea become wrong, and how far is that in points?
- How much price has to move before your thesis confirms or fails?
Answer those, and the time frame mostly chooses itself.
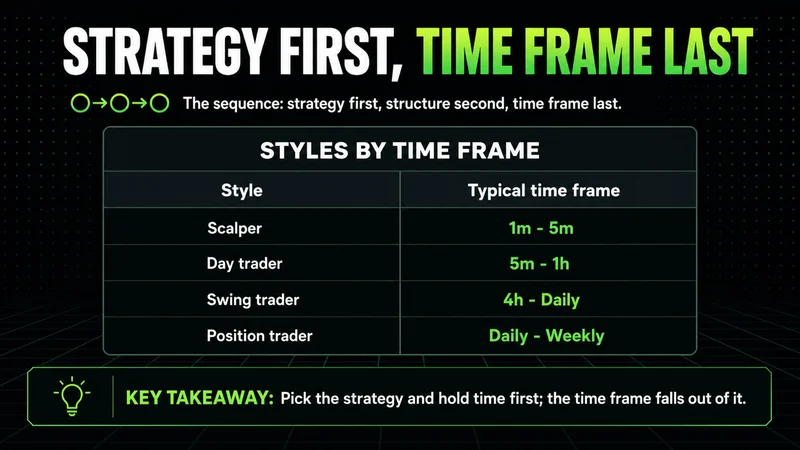
This is where most "best time frame for trading strategy" advice goes wrong. It hands you a number before it understands your hold time. The sequence matters: strategy first, structure second, time frame last.
Time frames by trading style: a working example
Trading styles cluster around time frames because hold time and chart resolution are linked. The table below is a starting reference, not a rule. Treat it as the center of a range, then adjust to your own execution.
| Trading style | Typical hold time | Common time frames | What it demands |
|---|---|---|---|
| Scalping | Seconds to minutes | Tick, 1-minute, 2-minute | Fast execution, tight spreads, full attention |
| Day trading | Minutes to hours | 5-minute, 15-minute, 1-hour | Intraday focus, flat by the close |
| Swing trading | Days to weeks | 1-hour, 4-hour, daily | Patience, wider stops, less screen time |
| Position trading | Weeks to months | Daily, weekly | Conviction, macro context, low activity |
Here is a concrete best time frame for trading example. A day trader builds bias on the 1-hour chart, reads structure on the 15-minute, and executes on the 5-minute. The higher chart sets direction. The lower chart times the entry. No single time frame does both jobs well, which is why most consistent traders run two or three together rather than one in isolation.
How time frame choice changes your risk
This is the part the personality-quiz articles skip. Your time frame is a risk decision before it is a style decision.
Lower time frames produce tighter stops and more trades. That sounds efficient until you count the costs. More trades mean more commissions, more spread paid, and more chances for emotion to override the plan. The stop is small in points but large in frequency.
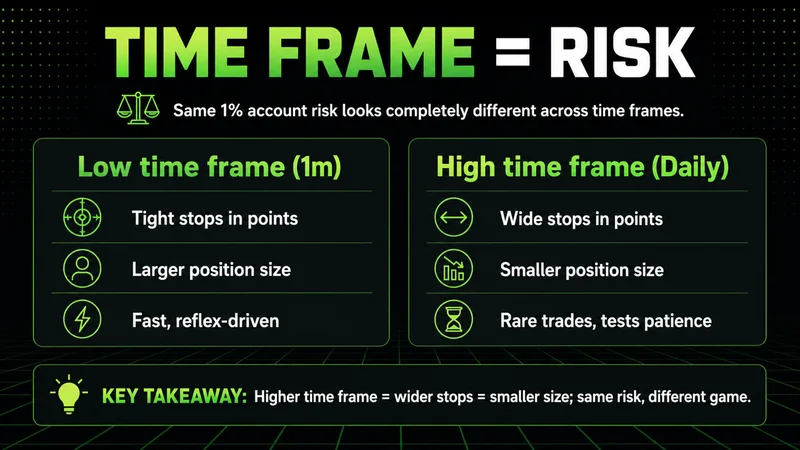
Higher time frames flip that. Stops are wider in points, so position size must come down to keep risk constant. Trades are rarer, which tests patience rather than reflexes. The same account risk of one percent looks completely different on a 1-minute chart than on a daily one, and traders who ignore that end up oversized without realizing it.
The main risk of best time frame for trading decisions is not the chart. It is sizing the position as if the time frame did not change the math. Define risk in money first, then let the time frame set the stop distance and the size that keeps that number fixed.
Most blown accounts do not start with a bad chart. They start with a position sized for a calm market and held into a volatile one.
Time frame versus market sessions
A time frame tells you how much price each candle holds. A market session tells you when that price is worth trading. They are not the same thing, and confusing them is a common error.
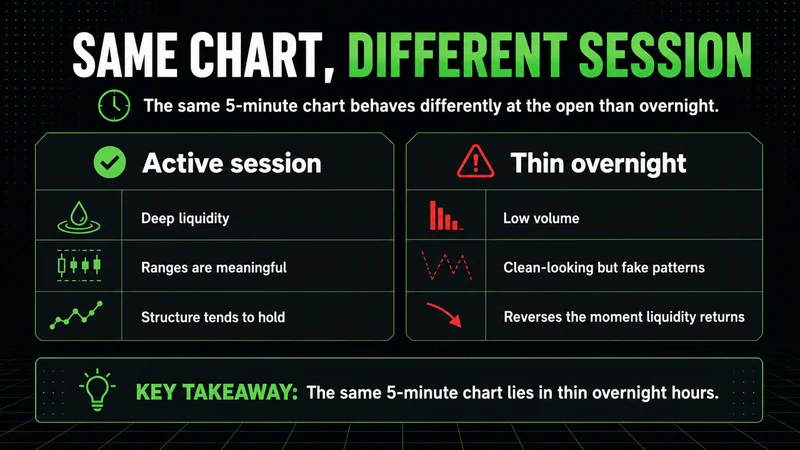
The same 5-minute chart behaves differently at the U.S. cash open than it does overnight. During active sessions, liquidity is deep, ranges are meaningful, and structure tends to hold. In thin overnight hours, the same candles can print clean-looking patterns on almost no volume, then reverse the moment real participants return.
So best time frame for trading versus market sessions is the wrong framing. You need both. The time frame is your lens; the session is the lighting. A sharp lens in poor light still shows you very little.
Rules for choosing and holding a time frame
A few rules keep this practical. None of them are exotic. They are the discipline that separates a chosen time frame from a constantly changing one.
- Pick a primary time frame for execution and one higher time frame for context. Two charts, not seven.
- Match the time frame to the hours you can actually watch the market. A 1-minute chart you can only check twice a day is a liability.
- Size the position so that one stop-out is an operational cost, not an emotional event.
- Keep the time frame fixed for a full sample of trades before judging it. Switching after two losses tells you nothing.
- Let the higher time frame set direction and the lower one time the entry. Do not take signals against your own context.
These best time frame for trading rules are deliberately boring. Consistency comes from doing the same readable thing repeatedly, not from optimizing the chart every week.
When a fixed time frame stops working
No time frame works in every condition, and pretending otherwise is how traders get hurt.
A 5-minute structure that reads cleanly during cash hours can mean almost nothing overnight on thin liquidity. The same is true around scheduled news. When volatility expands through an economic release, lower time frames fill with violent candles that respect no prior structure, and a stop that was sensible an hour earlier becomes a coin flip. Gold trades technically for hours and then invalidates the entire move within minutes once macro-driven volatility arrives.
This is the condition to watch for. Your time frame is calibrated to a certain pace of price delivery. When that pace changes, the chart that served you well starts lying. The fix is not a better time frame. It is recognizing the regime shift and standing aside until structure becomes readable again. Stepping away is sometimes the highest-quality decision the chart offers.
Common mistakes beginners make when picking a time frame
The same errors show up again and again, and most have nothing to do with chart selection itself.
- Dropping to a lower time frame to "find more trades" when the real problem is forcing trades in low-quality conditions.
- Switching time frames mid-trade to justify holding a loser, then calling it analysis.
- Watching a 1-minute chart while claiming to be a swing trader, then reacting to noise the strategy was never meant to see.
- Confusing a tighter stop on a lower time frame with lower risk, when frequency and slippage make the real cost higher.
- Treating the time frame as the edge, when execution quality and risk control are what actually compound.
These common best time frame for trading mistakes beginners make share a root cause. The trader is chasing activity, and the time frame is just the tool they reach for.
A simple checklist before you commit
Before you settle on a time frame, run through this short checklist. If you cannot answer each line, the chart is not your problem yet.
- How long do I intend to hold a typical trade?
- How many hours per day can I genuinely watch the market?
- Where does this trade become wrong, and how many points is that?
- What position size keeps my risk fixed at that stop distance?
- Which session am I trading, and does it have the liquidity this idea needs?
- Have I given this time frame a full sample before judging it?
This best time frame for trading checklist for new traders is not about finding a magic number. It is about confirming the chart fits the trader before a single order goes in.
FAQs
What is the best time frame for trading for beginners? The daily and 1-hour charts are the most forgiving starting point. They cut through intraday noise, produce cleaner structure, and give you time to think before acting, which matters far more early on than catching every move.
Is a lower time frame better because the stops are tighter? Not necessarily. A tighter stop in points often means more trades, more spread paid, and more emotional decisions. The real cost of a time frame is the full pattern of frequency, slippage, and discipline it demands, not the size of a single stop.
How many time frames should I trade at once? Two or three. One higher time frame for direction and context, one lower for execution, and optionally a middle one for structure. Beyond that you are usually adding noise, not clarity.
When should traders change their time frame? Only after a full sample of trades, and only for a structural reason, not after a couple of losses. Changing the chart to escape a drawdown is a discipline problem wearing the costume of analysis.
The bottom line
The best time frame for trading is decided by your hold time, your available screen time, and the risk you can hold without flinching, in that order. The chart is the last choice, not the first.
Pick a primary time frame for execution and a higher one for context. Size every position so a single stop-out stays an operational cost. Respect the session as much as the chart, and recognize when a volatility shift has made your time frame unreliable. Do that consistently, and the specific number on the chart matters far less than the process you build around it.
Worth the read?