
Descending Trendline — How to Draw and Trade It
A descending trendline connects lower swing highs in a downtrend. Learn how to draw, confirm, and trade it without fooling yourself with the line.
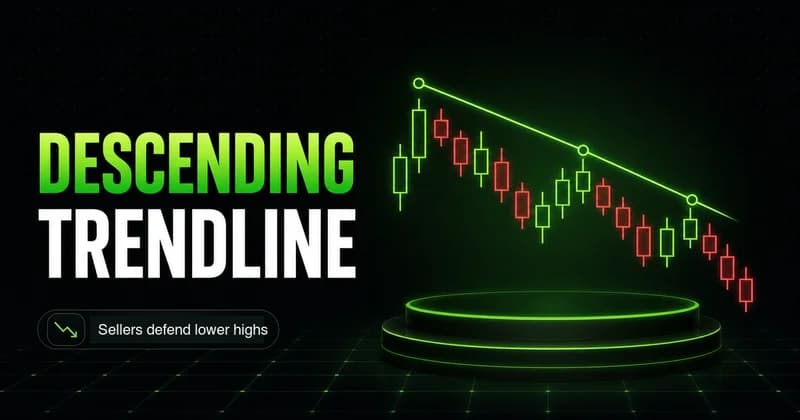
A descending trendline is a straight line connecting a series of lower swing highs in a downtrend. It maps where sellers keep stepping in, and each touch that holds confirms they are still in control. Drawn correctly, it is one of the cleaner ways to read who is winning the fight between buyers and sellers. Drawn carelessly, it becomes a line you bend to fit whatever you already wanted to believe.
That second outcome is more common than most traders admit. A descending trendline is only as useful as the discipline behind it, and the moment you start moving anchor points to make price respect the line, the line stops telling you anything.
What a descending trendline actually represents
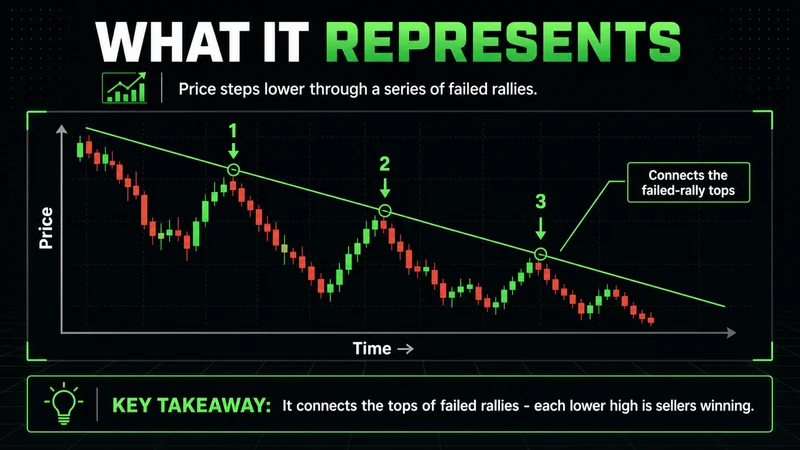
Price does not fall in a straight line. It steps lower, rallies into resistance, fails, and steps lower again. A descending trendline connects the tops of those failed rallies. Each lower high is a point where buyers tried to push price up and sellers absorbed the attempt.
The descending trendline meaning is simple once you frame it as behavior rather than geometry. The line is a record of repeated rejection. It is dynamic resistance that slopes down over time, and it holds because the same imbalance keeps showing up at progressively lower prices.
This matters because the line is reactive, not predictive. It does not forecast where price will go. It tells you what has been happening and where the next rejection is likely to occur if nothing in the underlying structure has changed.
How to identify a descending trendline on a chart
The drawing process is mechanical, and that is the point. A repeatable method removes the temptation to curve-fit.
- Confirm the market is in a downtrend first. You should see a sequence of lower highs and lower lows before a descending line means anything.
- Mark the highest relevant swing high as your first anchor.
- Find the next lower swing high where a rally clearly failed.
- Connect the two points with a straight line and extend it forward.
- Wait for a third touch. Two points define a line; the third touch is what gives it validity.
The third touch is the part most traders skip. A line drawn through two points will always look clean because two points always fit a straight line perfectly. Confirmation comes when price returns to that line a third time and gets rejected again. Until then, you are looking at a hypothesis, not a level.
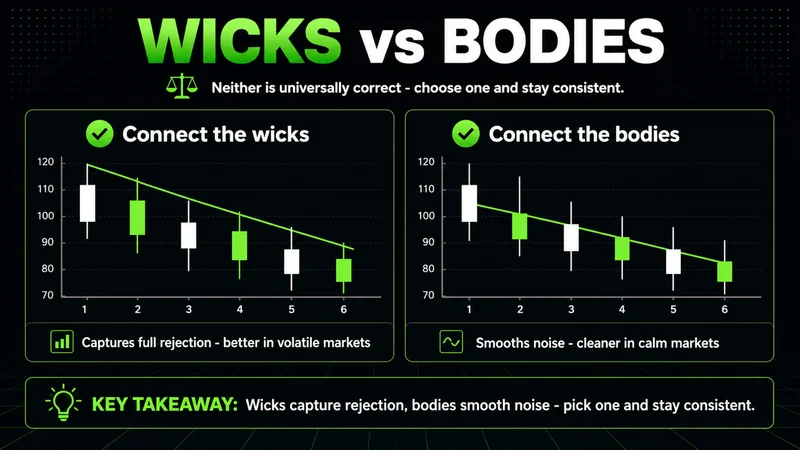
There is also a choice between connecting wicks or bodies. Neither is universally correct. Wicks capture the full extent of rejection and tend to work better in volatile, high-liquidity conditions where the tails carry real order flow. Bodies smooth out noise and tend to read cleaner in calmer markets. Pick one approach and stay consistent across a chart, because mixing them is how you end up drawing the line you wanted instead of the line that is there.
A descending trendline chart example, step by step
Picture a stock that tops out, then rallies twice into lower highs over several weeks. Connect the first high to the second, extend the line, and watch the third rally. If price pushes into the extended line and gets rejected with a clear failure to hold above it, you now have a confirmed descending trendline acting as resistance.
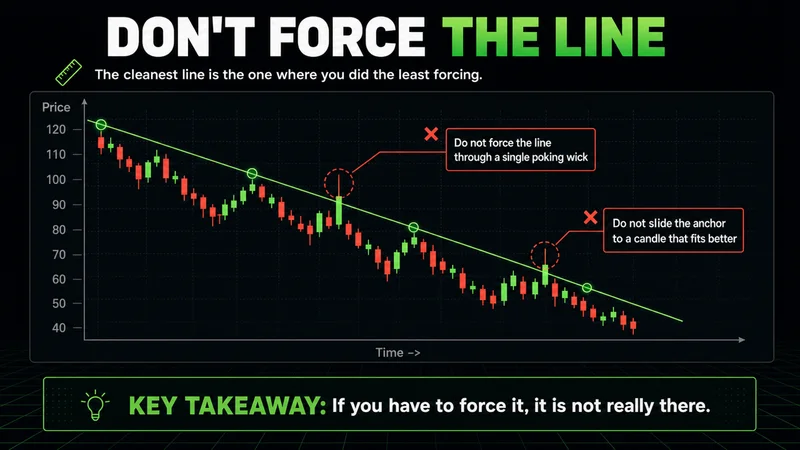
Notice what the example does not include. It does not include forcing the line through a single wick that pokes above it, and it does not include sliding the second anchor to a candle that fits better. The cleanest descending trendline example for beginner traders is the one where you did the least amount of adjusting. If you had to work hard to make price respect the line, the market is telling you the line is not real.
Descending trendline vs ascending trendline
The two are mirror images in construction but opposite in what they communicate. An ascending trendline connects rising swing lows and acts as dynamic support beneath an uptrend. A descending trendline connects falling swing highs and acts as dynamic resistance above a downtrend.
| Feature | Descending Trendline | Ascending Trendline |
|---|---|---|
| Connects | Lower swing highs | Higher swing lows |
| Acts as | Resistance | Support |
| Underlying trend | Downtrend | Uptrend |
| A break signals | Possible reversal up | Possible reversal down |
| Bias while intact | Sellers in control | Buyers in control |
The practical difference comes down to a few points worth keeping straight:
- A descending trendline slopes down and sits above price; an ascending trendline slopes up and sits below it.
- A break above a descending trendline suggests buyers are reclaiming control.
- A break below an ascending trendline suggests sellers are taking it.
- While intact, a descending line says sellers are still defending lower highs; an ascending line says buyers are still defending higher lows.
Same tool, opposite read. Confusing the two is one of the more common beginner errors, and it usually shows up as someone treating a downtrend rejection like a support bounce. The geometry is identical; the meaning is reversed, and the position you would take off each is the opposite of the other.
How to confirm a descending trendline before entering a trade
A line on its own is not a signal. Confirmation is what separates a structural read from a guess, and chasing a breakout without it is usually expensive.
Most breakouts fail because traders enter emotionally instead of structurally. The line breaking is not the trade. What price does after the break is the trade.
When price approaches a confirmed descending trendline from below, you are watching for rejection to continue the downtrend. When price breaks above it, you are watching for the break to hold. A clean confirmation usually includes a few things working together:
- A decisive close beyond the line, not just an intrabar spike that gets sold back.
- A retest where the broken line flips role, with former resistance acting as support.
- Acceptance, meaning price trades and holds on the other side rather than immediately snapping back.
- Context from the higher timeframe that agrees with the direction of the break.
The retest is where risk-defined entries live. Entering on the first touch of the break exposes you to every fakeout. Waiting for the retest costs you a few points of entry but gives you a defined invalidation: if price reclaims the line, you are wrong and you know it immediately. That defined invalidation is the whole point. It tells you where to place your stop and how to size the position so a single failed break is an operational cost, not an emotional event.
When a descending trendline stops working
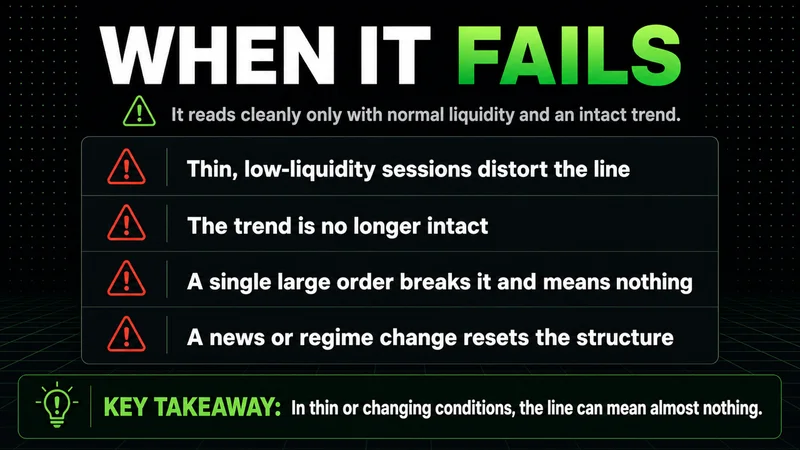
This is the part that gets left out of most explainers, and it is the most important part. A descending trendline reads cleanly when liquidity is normal and the trend is intact. It can mean almost nothing when conditions change.
In thin, low-liquidity sessions, price drifts through trendlines without any real participation behind the move. A break on light volume overnight is not the same event as a break during active hours, even though the line looks identical on the chart. The same sequence that would be a high-quality signal in cash hours becomes noise when no one is there to defend the level.
The line also breaks down when a macro catalyst overrides structure. A descending trendline can hold for weeks and then become irrelevant in minutes when a news-driven move expands volatility past anything the prior range contained. The technical level was real right up until the moment liquidity behavior changed underneath it. When that happens, the framework inverts: the line you were trusting becomes the trap.
The market does not care about the line you drew. It respects the imbalance behind it, and only for as long as that imbalance lasts.
Treat the line as valid only while the conditions that created it persist. The moment the volatility regime shifts or volume disappears, the descending trendline goes back to being a drawing. This is why blindly trusting a level that worked last week is how accounts bleed slowly: the chart looks the same, but the participation underneath it has already left.
Best timeframe for descending trendline analysis
There is no single correct timeframe, but timeframe alignment changes the validity of the same line. A descending trendline on a five-minute chart and one on a daily chart are not interchangeable, even when they look similar.
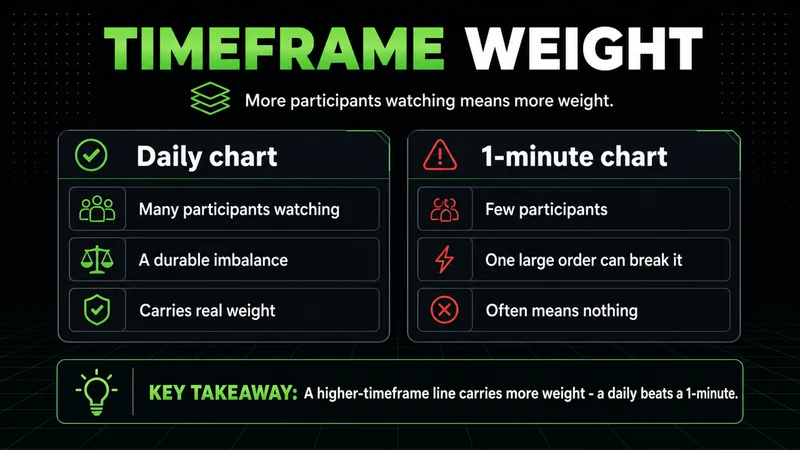
Higher timeframes carry more weight because more participants are watching and more capital is positioned around those levels. A descending trendline on the daily chart represents a more durable imbalance than one on a one-minute chart, where a single large order can break the line and mean nothing. The practical approach is to draw the line on the timeframe you trade, then check whether the higher timeframe agrees. When a lower-timeframe break aligns with higher-timeframe structure, the signal is stronger. When they conflict, the lower-timeframe break is the one more likely to fail.
Common descending trendline mistakes beginners make
Most of these come from wanting the line to confirm a bias rather than letting it describe what price is doing.
- Drawing the line through only two points and treating it as confirmed before the third touch.
- Adjusting anchor points repeatedly until price appears to respect a line it never actually respected.
- Mixing wicks and bodies on the same chart so the line has no consistent logic.
- Entering on the first break with no retest and no defined invalidation.
- Ignoring liquidity and volatility context, so a thin-market break gets treated like a real one.
- Trading a lower-timeframe line that conflicts with the higher-timeframe trend.
None of these are analysis problems. They are discipline problems. The tool is simple; the difficulty is staying honest about what the chart shows when it disagrees with what you hoped to see.
A descending trendline checklist for new traders
Before you act on a descending trendline, run through this. If any item fails, the setup is lower quality than it looks.
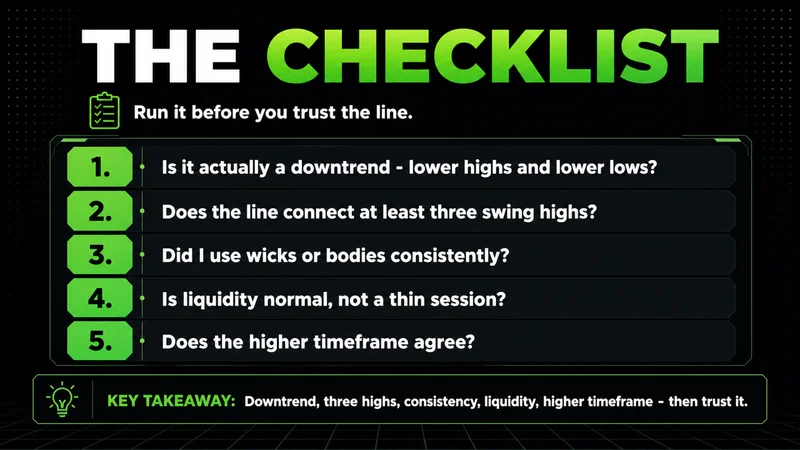
- Is the market actually in a downtrend, with lower highs and lower lows?
- Does the line connect at least three swing highs, not just two?
- Did I use wicks or bodies consistently?
- Is liquidity normal, or am I reading a thin-session move?
- Does the higher timeframe agree with the direction I am considering?
- Do I have a defined invalidation level and a position size that survives being wrong?
The checklist exists to slow you down at the point where most mistakes happen. Process over outcome is not a slogan here. It is the difference between a repeatable read and a story you told yourself about a line.
FAQs
What is a descending trendline in trading? It is a straight line connecting a series of lower swing highs during a downtrend. It acts as dynamic resistance and shows that sellers are repeatedly stepping in at progressively lower prices.
How do you confirm a descending trendline? Wait for at least three touches before treating it as valid. Two points always fit a line; the third rejection is what confirms the level is real rather than coincidental.
What does it mean when a descending trendline breaks? A decisive close above the line suggests buyers are reclaiming control and a reversal may be developing. The break is only meaningful if it holds on a retest rather than snapping back below the line.
Should I connect wicks or bodies when drawing a descending trendline? Either can work, but stay consistent on a given chart. Wicks capture the full extent of rejection and suit volatile conditions; bodies filter noise and read cleaner in calmer markets.
What is the best timeframe for a descending trendline? Use the timeframe you trade, then confirm against a higher one. Higher-timeframe lines carry more weight because more capital is positioned around them, so a break that aligns across timeframes is stronger.
Why does my descending trendline keep failing? Usually because it was drawn on two points, adjusted to fit a bias, or traded without context. A line that breaks in a thin session or against the higher-timeframe trend was lower quality than it appeared.
Worth the read?


