
Elliott Wave Theory — A Trader's Guide to Wave Counts
Elliott wave theory maps trends into repeating wave patterns. What a count can and cannot tell you, plus a confirmation checklist before trading one.
Elliott wave theory is the idea that markets move in repeating wave patterns — five waves in the direction of the trend, three waves against it — because crowd psychology cycles between optimism and fear in a structured way. The pattern shows up often enough to be useful. The way most traders apply it is not.
The problem is rarely the theory itself. It is treating a wave count as a prediction instead of a hypothesis. A count tells you where price might sit inside a larger trend and, more importantly, where that read becomes wrong. Used that way, it is a context tool with a built-in invalidation level. Used as a forecast, it becomes a story the chart will keep rewriting against your position.
What Elliott wave theory actually means
Ralph Nelson Elliott was an accountant, not a trader. In the 1930s, after studying decades of market data, he argued that price movement is not random noise — it is the footprint of crowd psychology, and crowds behave in recognizable sequences. He published the idea in The Wave Principle in 1938, and the framework has carried his name since.
The meaning of Elliott wave theory is simpler than the labeling makes it look. Markets trend, then they correct. The trending move tends to unfold in five waves. The correction against it tends to unfold in three. Optimism builds in stages, gets interrupted by doubt, and resolves into either continuation or reversal. Elliott's claim was that this rhythm repeats at every scale — the same five-three structure appears on a weekly chart and inside a single session, each wave subdividing into smaller versions of itself.
That fractal quality is the part beginners usually hear last, and it matters more than the wave labels. A five-wave move on the hourly chart might be only wave 1 of a larger structure on the daily. Context decides what a count means. Without the higher timeframe, a count is a drawing, not an analysis.
What the theory does not claim is precision. Elliott described tendencies in crowd behavior, not a schedule. The waves give structure to a trend that already exists. They do not tell you when the next one starts.
The Elliott wave chart pattern: five waves up, three waves down
The core Elliott wave chart pattern has two halves. The motive phase moves with the trend and is labeled 1 through 5. Waves 1, 3, and 5 push in the trend direction. Waves 2 and 4 are the pullbacks between them. The corrective phase moves against the trend and is labeled A-B-C — typically a drop, a weak bounce, and a final drop, in an uptrend's case.
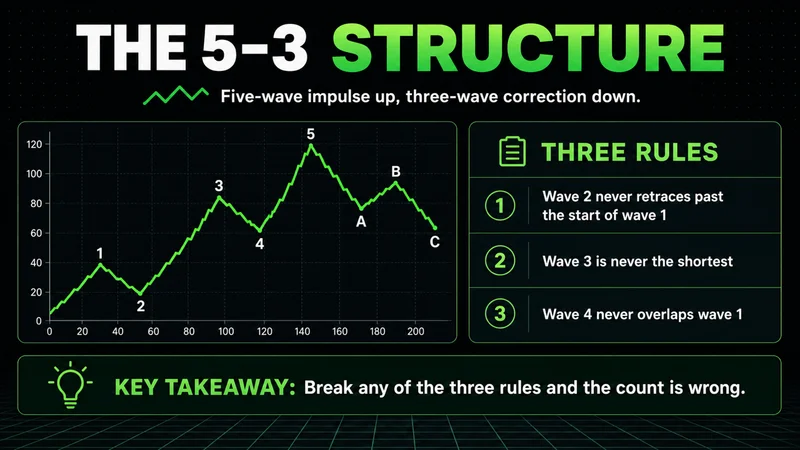
Three rules hold the structure together. They are not guidelines — if any one breaks, the count is wrong and needs to be redone:
- Wave 2 never retraces more than 100% of wave 1. If price trades below the start of wave 1, that count is invalid.
- Wave 3 is never the shortest of waves 1, 3, and 5. It is often the longest and almost always carries the strongest momentum.
- Wave 4 does not enter the price territory of wave 1. Overlap means the impulse read is broken.
These rules are the most practical part of the entire theory, because they convert an opinion into something falsifiable. A labeled chart with no invalidation is decoration. A count that says "this read dies below that swing low" is a risk framework. The rules hand you the level; whether you respect it is a discipline question, not an analysis question.
The corrective side is messier by design. Corrections come in flats, zigzags, and triangles, and they can stack into combinations. If a chart looks unreadable, it is usually because price is in a correction. That is information too — unclear structure is a reason to wait, not a reason to force a label onto it.
Wave personality and the Fibonacci connection
Each wave tends to carry a recognizable character, and reading that character is more useful than memorizing diagrams:
- Wave 1 is tentative. Most participants still believe the prior trend; volume is often unimpressive.
- Wave 2 is the deep shakeout. It retraces hard, sentiment turns negative, and weak hands exit right before the strongest leg.
- Wave 3 is the move with displacement — strong momentum, expanding range, and no immediate rejection. If you have to squint to find it, it probably is not wave 3.
- Wave 4 is sideways boredom. Shallow, choppy, and frustrating, it tends to alternate in character with wave 2.
- Wave 5 is the tired push. Price makes a new extreme while momentum quietly diverges underneath it.
Fibonacci ratios give the personalities a rough map. Wave 2 commonly retraces 50% to 61.8% of wave 1. Wave 3 often extends to 161.8% of wave 1. Wave 4 frequently holds near a 38.2% retracement of wave 3. These are tendencies measured across many markets, not laws. A Fibonacci level on its own is just a line — it earns relevance only when price reacts at it with visible rejection or acceptance.
The honest way to use the ratios is as a filter. If a count requires price to behave in a way the typical proportions rarely produce, the count is probably wrong, not the market.
How to identify Elliott wave theory structure on a chart
Identifying Elliott wave structure on a live chart is a process of elimination, not inspiration. The sequence matters:
- Start on a higher timeframe. Mark the dominant swing highs and lows first, before any labels.
- Find the most obvious impulse — a leg with clear momentum, expanding candles, and minimal overlap. Anchor the count there.
- Label backward from that obvious move rather than forward from a guess. The clearest wave on the chart is usually a third wave.
- Apply the three rules. If any one fails, recount. Do not bend a rule to save a label.
- Write down the invalidation level the count implies — the exact price where the read is wrong.
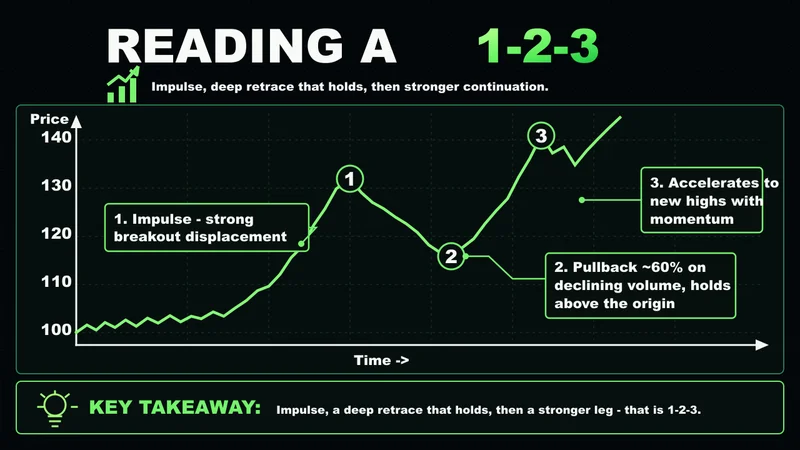
A practical example for traders: an index future breaks out of a range with strong displacement, pulls back roughly 60% of that leg on declining volume, then accelerates to new highs with momentum. That sequence — impulse, deep retrace that holds above the origin, stronger continuation — is the 1-2-3 skeleton. You did not need to predict it. You needed to recognize it while it was forming and know the level where the recognition would be wrong.
If a chart resists a clean count after a few minutes, the answer is not a more creative label. The answer is that structure is unclear, and unclear structure is a low-quality condition for this tool.
Is there an Elliott wave theory indicator?
There is no indicator that measures Elliott waves directly, because a wave count is an interpretation, not a calculation. What exists are tools that approximate parts of the job. The Elliott wave oscillator — effectively a histogram of the difference between a 5-period and a 34-period average — helps highlight where momentum peaks, which tends to coincide with third waves and diverge into fifth waves. Auto-counting tools go further and print labels on the chart for you.
Treat the auto-counters with skepticism. They repaint. A label that confidently reads "wave 3" during the move becomes "wave C" after the reversal, and the tool never has to answer for it. Indicators are tools, not decision-makers — and an indicator that revises its own history after the fact is closer to a narrative generator than a tool. Watch one through a single volatile session and count how many times the labels change; that is the certainty you would have been trading on.
The defensible use of any oscillator here is confirmation of wave personality. Momentum should peak in wave 3 and diverge in wave 5. If your count says wave 3 but momentum is fading, the count disagrees with the tape, and the tape gets the vote.
From wave count to trading signal — confirmation comes first
A wave count by itself is not an Elliott wave trading signal. It is a map of where opportunity might appear. The tradeable moments are specific: the end of wave 2, where risk can be defined against the origin of wave 1 ahead of the strongest leg; the end of wave 4, ahead of the final push; and the completion of wave 5 or a C-leg, where a reversal or a new impulse may begin.
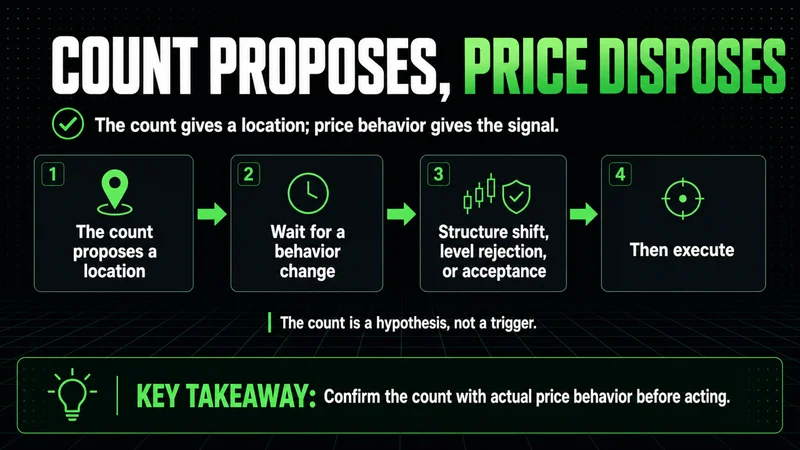
How to confirm Elliott wave theory before trading it is the part most guides skip. The count proposes; price action disposes. Before execution, the location should show an actual change in behavior — a shift in short-term structure, rejection of the level you care about, or acceptance back inside the range that matters. A wave 2 entry without a structural trigger is a guess with a Fibonacci ratio attached.
A wave count is a hypothesis with an invalidation level, not a forecast with a deadline.
That distinction changes trade management. If the entry triggers and the level holds, the count is doing its job and the position can be managed toward the next structural objective. If price takes out the invalidation, the trade is over — not paused, not "early." The count was wrong, and the cost of being wrong was defined in advance. That is the entire value proposition: not better predictions, but cheaper mistakes.
Elliott wave theory vs trend analysis — what each one is for
Plain trend analysis answers one question: what is price doing right now? Higher highs and higher lows, structure intact or broken, momentum present or absent. It is descriptive, it requires few assumptions, and it is hard to argue with.
Elliott wave theory tries to answer a harder question: where inside the larger cycle is this trend? That is more information — a trend that is likely in a third wave invites different behavior than one grinding through a fifth on fading momentum. But more information costs more assumptions. The count can be wrong in ways simple structure analysis cannot, because structure analysis never claimed to know what comes next.
For execution, plain structure is usually enough. Entries, stops, and management live on observable swings, not on labels. Where Elliott earns its keep is context: judging the maturity of a trend, tempering aggression late in a move, and flagging when a "pullback" has done too much damage to still be a pullback. The two approaches are not competitors. One describes the present; the other frames how much of the move may already be behind you.
Where Elliott wave theory breaks down
This is the section most Elliott wave content avoids, and it is the one that decides whether the tool helps you or hurts you.
The first problem is subjectivity. Two competent analysts can label the same chart differently, and both counts can satisfy every rule. The theory permits enough alternate counts that almost any outcome can be reconciled after the fact. That flexibility is why critics call it unfalsifiable in practice, even though each individual count is falsifiable at its invalidation level.
The second problem is the recount. When a count fails, the standard response is to relabel — and because relabeling is always available, the theory never looks wrong in hindsight. The analyst absorbs the loss; the framework keeps its record clean. If you find yourself recounting while holding a losing position, you are no longer analyzing. You are negotiating.
Conditions matter too. On a clean trend day in index futures, impulse structure can read almost textbook. In a thin overnight session, or in the minutes around a major economic release, the same five-wave label means very little — volatility driven by positioning and forced flows rewrites the count faster than anyone can justify it. Choppy, news-heavy ranges are corrective by definition, which means the theory's least reliable patterns dominate exactly when traders most want guidance.
The common Elliott wave theory mistakes beginners make follow directly from all of this:
- Forcing a count onto every chart, including ones with no readable structure.
- Trading the label instead of the level — entering because "it should be wave 3" without any confirmation.
- Recounting mid-trade to avoid taking the planned loss.
- Counting noisy low-timeframe charts where overlap makes most impulse rules meaningless.
- Ignoring the invalidation the count itself defined, which removes the only objective part of the method.
An Elliott wave theory checklist before you take the trade
A checklist keeps the subjective parts of this method honest. Before risking capital on a wave count, every item should hold:
- The count obeys all three rules with no exceptions and no creative relabeling.
- The count agrees with the higher-timeframe structure rather than fighting it.
- Fibonacci levels support the count; they are not the only evidence for it.
- A confirmation trigger exists — a structure shift, clear rejection, or acceptance at the level, not just an expectation.
- The invalidation price is written down, and position size is calculated from the distance to it.
- If the invalidation hits, the plan is exit first, recount flat. No exceptions while in the position.
For new traders, the checklist matters more than the count itself. It will keep you out of trades more often than it gets you in, and that is the point — the framework's edge, where it has one, lives in the small number of positions where structure, location, and confirmation all align and the cost of being wrong is known before entry.
FAQs
What is Elliott wave theory in simple terms? It is the observation that markets tend to move in repeating wave patterns — five waves with the trend, three against it — because crowd psychology shifts between optimism and fear in stages. Traders use the pattern to judge where price might sit inside a larger trend and where that read becomes invalid.
What is the best timeframe for Elliott wave theory? Higher timeframes — daily, 4-hour, and weekly charts — produce cleaner counts because each swing contains more participation and less noise. Counts on very low timeframes break rules constantly and invite relabeling. A practical approach is to count on the higher timeframe and execute on a lower one.
How does Elliott wave theory affect trading decisions? Properly used, it shapes context rather than entries. A trader who judges a trend to be in a third wave can hold continuation positions with more patience, while a likely fifth wave argues for reduced aggression and tighter management. The count also supplies an exact invalidation level, which defines risk before entry.
What is the difference between impulse and corrective waves? Impulse waves move in the direction of the larger trend, unfold in five waves, and show strong directional momentum. Corrective waves move against the trend, unfold in three waves, and tend to be choppy and overlapping. Most unreadable charts are corrections in progress.
Does Elliott wave theory actually work? It works as a context and risk framework, not as a prediction engine. The rules create falsifiable counts with defined invalidation levels, which is genuinely useful. Its weakness is subjectivity — multiple valid counts can describe the same chart, so the method rewards traders who wait for confirmation and punishes those who trade the label alone.
Worth the read?


