
Hammer Candlestick — What It Signals and How to Trade It
A hammer candlestick signals sellers were rejected at lower prices. Learn what the hammer pattern means, how to confirm it, and when it fails.

A hammer is a single candle with a small body near the top and a long lower wick, and it tells you that sellers pushed price down hard during the session before buyers took it back by the close. That rejection of lower prices is the entire message. The hammer meaning is not "buy here" — it is "sellers tried and failed at this level." What you do with that information depends almost entirely on where the candle prints and what happens next.
Most beginners treat the hammer as a signal. It is closer to a question. The market is asking whether buyers can hold the ground they just reclaimed. The candle alone does not answer it.
What a hammer candlestick actually tells you
The hammer pattern is a potential bullish reversal candle that forms after a move lower. Its shape is specific: a real body sitting in the upper third of the range, a long lower shadow at least twice the height of that body, and little or no upper shadow. The color of the body matters less than most guides claim. A green hammer is marginally stronger because price closed above its open, but a red hammer at the right location can carry the same weight.
The structure encodes a sequence. Price opened, sellers drove it down through the session, and then buyers absorbed that supply and lifted the close back near the high. The long wick is the footprint of that fight. When you read a hammer, you are reading a rejection of lower prices, nothing more and nothing less.
That is also why context decides everything. A hammer in the middle of a choppy range is noise. The same candle at a level where price has reacted before, after an extended move lower, is a piece of information worth respecting.
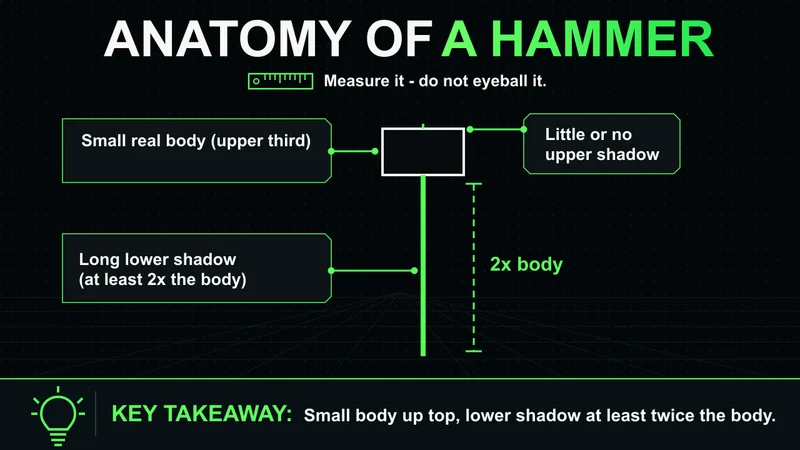
The anatomy of the hammer pattern
If you want to identify a hammer on a chart reliably, measure it rather than eyeballing it. A valid hammer meets a few structural conditions:
- The lower shadow is at least twice the length of the real body. Longer is better.
- The real body sits in the upper portion of the candle's total range.
- The upper shadow is small or absent. A long upper wick changes the read entirely.
- The candle appears after a downward move, not in isolation.
The long lower wick is the part that carries the signal. It shows price was rejected from lower levels within a single session. A candle with a small body and short wicks is a spinning top or a doji — indecision, not rejection. The distinction is mechanical, and it is worth being strict about it. Loose pattern definitions are how beginners end up calling every small-bodied candle a hammer.
The inverted hammer is the mirror image: small body near the lows, long upper shadow. It carries a related but weaker message and needs the same confirmation discipline. The hanging man is identical in shape to the hammer but appears after an uptrend, where the same rejection wick warns of exhaustion rather than a bottom. Shape alone never tells you which one you are looking at. Location does.
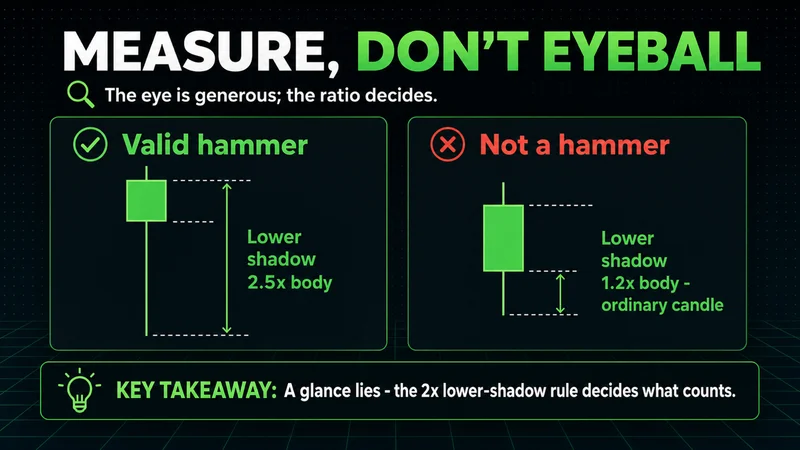
Measuring matters because the eye is generous. A wick that looks long at a glance often turns out to be only slightly longer than the body when you actually check it, and that difference is the line between a hammer and an ordinary candle. The discipline here is the same discipline that shows up everywhere else in trading: defined rules beat impressions. If the candle does not clear the structural bar, it is not a hammer, regardless of how suggestive it looks on the chart.
A hammer chart example, read in context
Consider a hammer chart example the way a trader actually sees it, not the way a textbook draws it. Price has been declining for several sessions. It reaches a level where buyers stepped in before — a prior swing low, a value area, a level that produced a reaction in the past. On that candle, price spikes lower, then closes back near the open. A long lower wick prints.
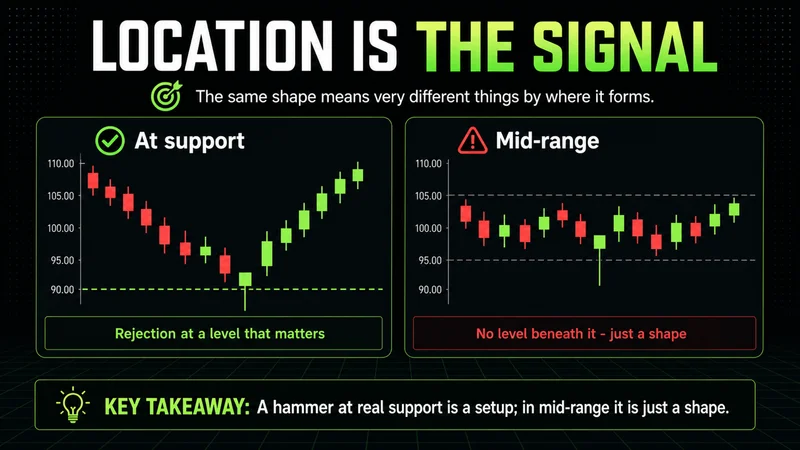
That is a hammer worth watching. Not because the candle is special, but because the rejection happened at a level that already mattered. The confluence is the signal. Strip the level away and you are left with a candle that means very little.
Now run the same shape in the middle of a sideways range with no clear level beneath it. Identical candle, almost no information. This is the part most hammer explained for beginners content skips: the pattern is conditional. The shape is necessary but not sufficient. What turns a hammer into a reversal signal is everything around it — the trend that preceded it, the level it tested, and the behavior that follows.
Hammer vs doji — what actually separates them
A hammer and a doji get confused constantly, usually because both have small bodies. The difference is not cosmetic. They describe two different things the market is doing.
| Feature | Hammer | Doji |
|---|---|---|
| Real body | Small, near the top of the range | Almost none; open and close nearly equal |
| Lower shadow | Long, at least twice the body | Varies; not the defining feature |
| What it shows | Rejection of lower prices | Balance between buyers and sellers |
| Typical message | Potential bullish reversal after a decline | Indecision; trend may pause or turn |
| Confirmation need | High — wait for the next candle | High — direction is genuinely unclear |
Here is the hammer vs doji explained in one line: a hammer shows one side losing a fight, a doji shows neither side winning. A hammer has a directional bias built into its structure because the close recovers toward the high. A doji is closer to a stalemate. Both demand confirmation, but they are pointing at different conditions. Treating them as interchangeable is a common way to misread a chart.
How to confirm a hammer before you enter a trade
This is where most of the damage gets done. A hammer by itself is incomplete. Hammer confirmation means waiting for evidence that buyers are actually following through, instead of assuming the wick was enough.
The cleanest confirmation is the next candle closing above the hammer's high. That close shows the buyers who reclaimed the level are still in control and willing to push. Without it, the hammer is just a wick that has not been validated.
Most reversals fail because traders enter on the candle instead of the confirmation. The hammer is the invitation, not the trade. Chasing the wick without waiting for follow-through is how a clean-looking setup turns into a loss before it ever had a chance to work.
A few conditions strengthen the read into a genuine hammer reversal signal:
- The next candle closes above the hammer's high, confirming follow-through.
- The hammer formed at a level that already mattered — a prior swing low or a tested support area.
- Volume on the hammer or the confirmation candle is elevated, showing real participation rather than a thin-liquidity spike.
- The broader context supports a bounce — the decline was extended, not the first candle of a fresh move lower.
None of these are guarantees. Confirmation lowers the rate of false signals; it does not remove them. The point of waiting is not certainty. It is to stop acting on incomplete information, which is a different and more achievable goal.
The timeframe problem most beginners miss
The same hammer means different things on different charts, and the best timeframe for hammer analysis is the one that matches how you actually manage risk. A hammer on a daily chart reflects an entire session of order flow — thousands of decisions resolving into one candle. A hammer on a one-minute chart reflects sixty seconds, and most of those wicks are noise.
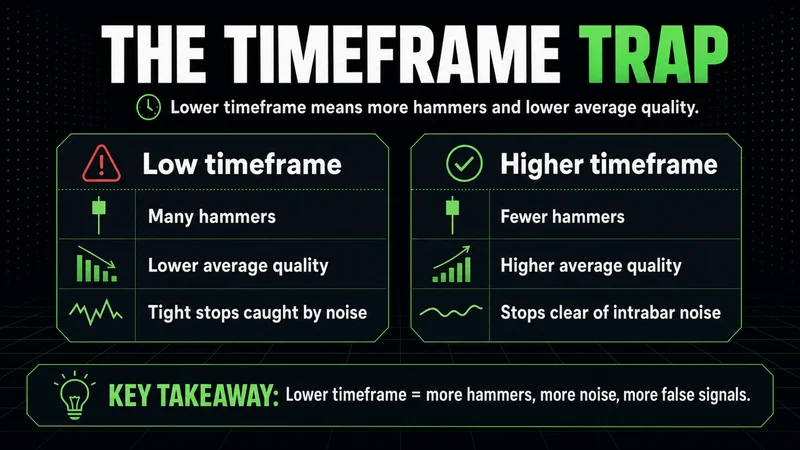
This directly affects how hammer trading affects risk. The lower the timeframe, the more frequent the patterns and the lower the average quality. You get more hammers and more false ones. Your stop, placed below the hammer's low, is also tighter, which sounds efficient until normal intrabar noise takes you out of a read that was structurally correct.
Higher timeframes give you fewer signals but cleaner ones, with wider stops that respect actual volatility. The tradeoff is real and it is not free. A practical approach is to read the level and bias from a higher timeframe, then refine the entry on a lower one — but the decision-making anchor stays on the chart where the rejection carries weight. Picking a timeframe is a risk decision disguised as a charting preference.
When a hammer is noise, not a signal
The hammer breaks down in specific, knowable conditions, and naming them is more useful than another list of when it works. The pattern fails to mean anything in at least three situations.
First, on thin liquidity. A long lower wick on a low-volume candle — overnight in a futures session, or in a quiet asset — is often a single order pushing price into an air pocket and getting filled back. The wick looks identical to a high-conviction rejection, but no real fight took place. The shape is there; the substance is not.
Second, with no level beneath it. A hammer floating in open space, with no prior support, no swing low, no tested area, is a candle without a reason. The rejection happened, but it rejected nothing meaningful. Reversals need something to reverse against.
Third, in a strong, accelerating downtrend. When price is in genuine displacement to the downside, single-candle bounces get overrun. The hammer prints, the next candle takes out its low, and the "reversal" becomes a continuation. Counter-trend hammers against momentum are among the lowest-quality versions of the pattern. The candle reads cleanly in hindsight on a chart that already turned; in real time, against strong selling, it is frequently just a pause.
The pattern works when there is a real fight at a level that matters. Strip away the liquidity, the level, or the context, and the same shape means almost nothing.
The useful habit is to assume a hammer is noise until the surrounding conditions argue otherwise. That sounds pessimistic, but it matches how the pattern actually performs. Far more hammers print in unremarkable conditions than at genuine turning points, simply because price spends most of its time in chop rather than at meaningful reversals. Starting from skepticism and requiring the candle to earn your attention filters out the majority of the low-quality versions before they ever reach a decision.
Common hammer mistakes beginners make
The common hammer mistakes beginners make are predictable, which means they are avoidable. Most of them come from treating the candle as the whole trade.
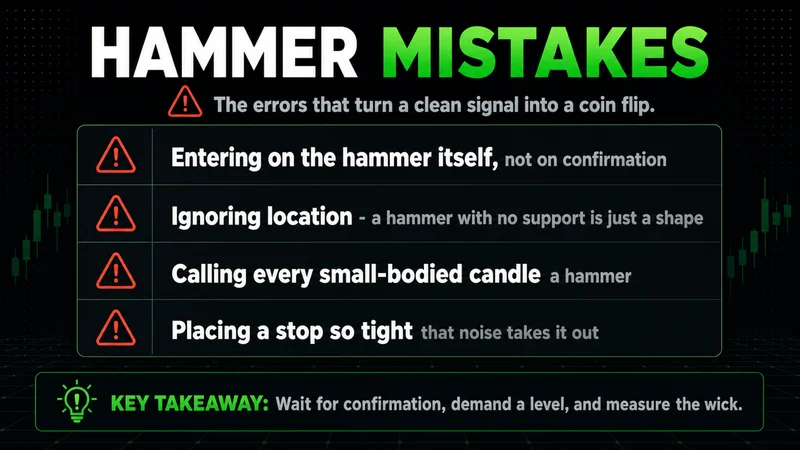
- Entering on the hammer itself instead of waiting for confirmation. The single most expensive habit.
- Ignoring location. A hammer with no support beneath it is a shape, not a setup.
- Calling every small-bodied candle a hammer. If the lower shadow is not at least twice the body, it is something else.
- Trading hammers on timeframes too low for the strategy, then getting stopped out by normal noise.
- Skipping the stop. The hammer's low is the natural invalidation; trading without it removes the only objective exit the pattern offers.
- Sizing as if the pattern were a certainty. Single-candle patterns produce false signals routinely, and position size should reflect that.
The thread running through all of these is the same: the hammer is one input, not a complete decision. Traders who lose money on it usually skipped the context and the confirmation and traded the picture.
A hammer checklist for new traders
A hammer checklist for new traders is most useful as a filter that slows you down before you act. Run through it before treating any hammer as tradable:
- Did the candle form after a downward move, not inside random chop?
- Is the lower shadow at least twice the real body, with little or no upper wick?
- Did it print at a level that already mattered — a prior low or a tested support area?
- Has the next candle closed above the hammer's high to confirm follow-through?
- Is there enough volume or participation to suggest a real fight, not a thin-liquidity spike?
- Is the timeframe appropriate for how you size and manage the trade?
- Is your invalidation defined — a stop below the hammer's low — before you enter?
If the answer to several of these is no, the hammer is not a setup yet. That is the correct outcome more often than beginners expect. Most hammers do not pass the full filter, and waiting through the ones that fail is part of the process, not a failure of it.
FAQs
What is a hammer in trading? A hammer is a single candlestick with a small body near the top of its range and a long lower shadow at least twice the body's height. It forms after a decline and signals that sellers were rejected at lower prices, making it a potential bullish reversal candle when it appears at a meaningful level.
What does the hammer pattern mean? It means price was pushed lower during the session and then bought back up before the close. The long lower wick is the rejection. On its own it signals a possible shift, but it needs confirmation and the right location to carry weight.
How do you confirm a hammer before entering a trade? Wait for the next candle to close above the hammer's high. That follow-through shows buyers are still in control. Confirmation is stronger when the hammer formed at a tested level and printed on real volume rather than a thin-liquidity spike.
What is the difference between a hammer and a doji? A hammer shows one side losing a fight, with a directional bias because the close recovers toward the high. A doji shows balance, with the open and close nearly equal and no clear winner. The hammer leans bullish after a decline; the doji is pure indecision.
Does the color of a hammer matter? Slightly. A green hammer closes above its open and is marginally stronger, but a red hammer at the right level can carry the same message. Location and confirmation matter far more than body color.
What is the best timeframe for a hammer? Higher timeframes produce fewer but cleaner hammers with stops that respect real volatility. Lower timeframes produce more patterns and more false ones. The best timeframe is the one that matches how you size and manage risk.
When does the hammer pattern fail? It fails on thin liquidity, where the wick is a single order filled back rather than a real fight. It fails with no support beneath it, and it fails against a strong, accelerating downtrend where single-candle bounces get overrun.
Is the hammer a reliable reversal signal? It is a single-candle pattern, so false signals are common. Reliability improves sharply with confirmation, a meaningful level, and supportive context, but no version of it removes the need for a defined stop and disciplined position sizing.
Worth the read?


