
Industry Analysis — Read the Industry Before the Company
Industry analysis reads an industry's structure and growth before you commit to any company inside it. Frameworks, metrics, and a clear process.

Industry analysis is the study of the economic conditions, competitive structure, and growth drivers of a specific industry before you commit capital to any company inside it. It answers one question that company-level numbers cannot: is this a good business to be in at all? A strong company in a deteriorating industry is still fighting the current, and most investors find that out too late.
The order matters. Most people read a single company first, fall for the story, and then go looking for reasons the industry supports it. That is backward. The industry sets the ceiling on what any single name can earn, how durable those earnings are, and how much competition will erode them over time. Read the environment first, then read the company against it.
What industry analysis actually tells you
At its core, industry analysis measures the structural health of a market and the forces shaping its profitability. You are looking at demand growth, pricing power, barriers to entry, regulatory exposure, and how the players inside the industry compete for the same pool of customers.
The output is not a buy or sell signal. It is context. It tells you whether the companies you are about to study operate in a profit pool that is expanding, stable, or shrinking, and whether the average participant earns a real return on capital or simply survives. That context decides how much weight you put on any single company's results.
A few things a serious industry read should surface:
- The size of the addressable market and whether it is growing, flat, or contracting.
- The concentration of the industry, meaning whether a few players dominate or hundreds fight for scraps.
- The barriers that keep new competitors out, such as capital intensity, regulation, network effects, or brand.
- The bargaining power of suppliers and customers, which sets how much margin the industry can defend.
- The sensitivity of demand to the broader economy, interest rates, and commodity prices.
None of this requires a forecast. It requires reading what is already in front of you and refusing to assume the recent past extends forever.
Industry analysis vs sector analysis
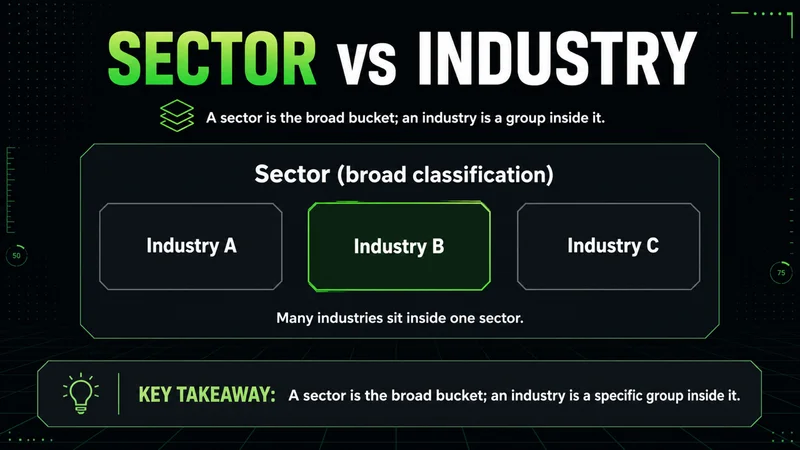
The terms get used interchangeably, and that costs people precision. A sector is a broad classification, the top level of the standard market taxonomy. Technology, energy, healthcare, financials, and industrials are sectors. An industry sits one level below, a narrower group inside a sector that shares the same business model and competitive set.
Industry analysis vs sector analysis comes down to resolution. Sector analysis tells you that energy is cyclical and tied to commodity prices. Industry analysis tells you that an oilfield services firm, an integrated major, and a renewable developer inside that same energy sector face completely different demand drivers, margin structures, and risks.
Use both, in order:
- Sector analysis filters the broad opportunity. It tells you where capital is rotating and which parts of the economy are in favor or out of favor.
- Industry analysis refines the read. It isolates the specific competitive environment a company lives in, which is where the real differences in profitability show up.
Stopping at the sector level is the more common mistake. Two companies in the same sector can have almost nothing in common operationally, and treating them as interchangeable is how diversification turns into duplicated risk.
The frameworks that carry the weight
You do not need a dozen models. You need two or three that you can apply consistently and actually defend with evidence. The popular industry analysis framework set is small, and each tool answers a different question.
Porter's Five Forces is the backbone. It examines five sources of competitive pressure that together determine how much profit an industry can keep:
- Threat of new entrants, governed by how hard it is to break in.
- Bargaining power of suppliers, which sets input costs.
- Bargaining power of buyers, which caps what you can charge.
- Threat of substitutes, meaning alternative ways customers meet the same need.
- Rivalry among existing competitors, which drives price wars and margin erosion.
PESTEL widens the lens to the external environment, and it is the right tool for industries where regulation or policy is the dominant variable, such as utilities, banking, or anything energy-related. It covers six forces:
- Political and regulatory pressure, including trade policy and licensing.
- Economic conditions, from growth and inflation to interest rates.
- Social and demographic shifts in how customers behave.
- Technological change that can reset the competitive set.
- Environmental constraints and the cost of compliance.
- Legal exposure, including liability and antitrust risk.
SWOT is the weakest of the three for industry work, because it drifts toward opinion fast. Used carefully, it is fine for organizing what you have already learned, but it should never be the source of your conclusions.
The metrics matter more than the framework names. A framework only earns its place when it is filled with the industry analysis metrics that actually move profitability:
- Revenue growth rate and whether it is accelerating or decelerating.
- Average operating margin across the industry, not just the leader.
- Return on invested capital, which separates real economics from accounting profit.
- Capital intensity and how much must be reinvested to stand still.
- Customer concentration and pricing power.
Frameworks organize the question. Metrics answer it. Skip the metrics and you have a tidy diagram that proves nothing.
How to do industry analysis, step by step
A repeatable process beats a clever one. Here is a step-by-step guide that holds up across most industries, from capital-heavy manufacturing to asset-light software.
- Define the industry boundary precisely. Decide who is actually competing for the same customer, because too broad a definition hides the real rivalry and too narrow a one misses the substitute threat.
- Size the market and its growth. Establish whether total demand is expanding, flat, or shrinking, and identify the structural driver behind that trend.
- Map the competitive structure. Count the meaningful players, measure concentration, and identify who sets prices.
- Run the framework. Apply Porter's Five Forces to gauge profit potential, then use PESTEL where regulation or macro policy dominates.
- Pull the numbers. Collect the industry analysis metrics above for the leaders and the average participant, so you can see the spread.
- Locate the cycle. Determine where the industry sits in its demand cycle and how sensitive it is to rates, the economy, and input costs.
- Write the conclusion as a thesis you can be wrong about. State what would have to change for the read to break, and what you would watch for.
That last step is the one most people skip. An industry analysis without a clearly stated invalidation is just a description. The discipline is in naming the conditions that would prove you wrong before you have any money on the line.
A worked industry analysis example
Take a concrete industry analysis example using semiconductor manufacturing, the kind of capital-heavy industry where structure dominates outcomes.
Demand is growing, driven by computing, automotive electronics, and data infrastructure. Barriers to entry are extreme, because a leading-edge fabrication plant costs billions and takes years to build, which limits new entrants to a handful of well-funded players. That concentration gives the leaders genuine pricing power during periods of tight supply.
The catch shows up when you pull the read apart force by force:
- Demand is growing but cyclical, swinging hard with the broader economy and with inventory cycles across the customers who buy the chips.
- Capital intensity is brutal, so when demand softens, fixed costs do not, and margins compress fast.
- Suppliers of specialized equipment hold real bargaining power, which raises the cost of staying competitive.
- Barriers to entry stay high, which protects the incumbents but does nothing to smooth the cycle.
Run that through the framework and the read is clear: a structurally attractive industry with high barriers and growing demand, but one where timing and the cycle matter as much as the structure. A company analyzed in isolation might look cheap at the top of a cycle and expensive at the bottom, precisely because the industry itself moves underneath it.
That is the whole point of the exercise. The example shows why industry analysis has to come before the company read, not after.
Where industry analysis fits in fundamental analysis
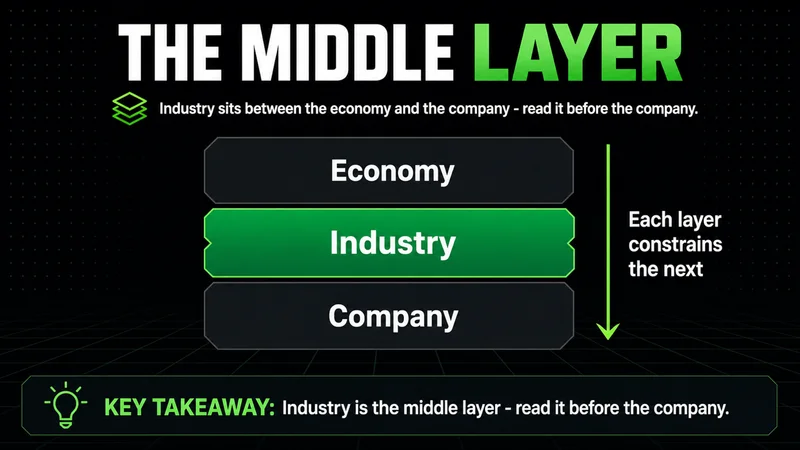
Industry analysis in fundamental analysis is the middle layer of the classic top-down approach, where each layer constrains the next:
- The macro layer sets the broad backdrop, covering growth, rates, and the credit cycle.
- The industry layer sets the profit pool, deciding how much any participant can earn and how durable that is.
- The company layer is read last, against the ceiling the first two layers already established.
The reason this ordering matters is influence. A company's results are largely a function of the industry it operates in. Margins, growth, and returns on capital cluster by industry far more tightly than they cluster by management quality. A disciplined operator in a structurally poor industry usually earns mediocre returns, while an average operator in a structurally strong one often does fine. The environment does most of the heavy lifting.
This is also why industry analysis helps stock analysis in a way company metrics alone cannot. When you value a single company, your assumptions about growth, margins, and durability are only credible if they are anchored to what the industry can actually support. An industry read keeps those assumptions honest. Without it, a discounted cash flow model is just a spreadsheet repeating whatever optimism you fed it.
When industry analysis stops working
Here is the honest limit. Industry analysis assumes the structure you are reading is stable enough to extrapolate. Most of the time it is. When the structure itself is shifting, the framework can read cleanly and still point you in the wrong direction.
Cyclical industries are the obvious trap. An industry can show expanding margins, rising returns on capital, and accelerating demand right at the top of its cycle, and every metric will look strong precisely when the risk is highest. The same numbers that signal health at the start of a cycle signal danger at the end. Reading the snapshot without locating the cycle is how investors buy the peak with full conviction.
The deeper failure is technological disruption. No framework built on the current competitive set survives a substitute that changes the business model. The structure reads as durable until a new way of meeting the same customer need arrives, at which point the barriers you measured stop protecting anything. This is the version of the saying that no analysis works in all conditions. The frameworks describe the present structure honestly. They do not warn you when that structure is about to be replaced, and that blind spot is exactly where the largest losses come from.
So treat industry analysis as a read on the current environment with a known expiration. It is most reliable in stable, mature industries and least reliable in young, fast-moving ones. The faster the underlying technology or regulation changes, the shorter the shelf life of your conclusion.
The mistakes that quietly distort an industry read
Why do careful investors still get the industry wrong? Most industry analysis mistakes are not analytical failures. They are discipline failures, and a short checklist for beginners catches the common ones.
- Extrapolating recent growth as if it were permanent. The last three good years are not a forecast.
- Confusing a strong company with a strong industry. The two are independent, and conflating them is the most expensive error here.
- Ignoring the cycle. A metric read at the wrong point in the cycle inverts its meaning.
- Defining the industry too broadly, which buries the real competitive pressure under unrelated names.
- Skipping the substitute threat because it does not exist yet. The threat that is not visible today is the one that does the damage.
- Treating a framework diagram as a conclusion. The model organizes the question; the evidence answers it.
The fix for all of them is the same. State your industry thesis as something falsifiable, name the conditions that would prove it wrong, and check it against the cycle before you let it influence a single position. Process over conclusion, every time.
What to actually take away
Industry analysis is not a forecasting tool, and it is not a buy signal. It is the context that decides how much weight every company-level number deserves. Read the industry first, because it sets the ceiling on what any company inside it can earn.
The work is straightforward and repeatable: define the industry tightly, size its growth, map the competition, run a framework filled with real metrics, locate the cycle, and write a conclusion you can be proven wrong about. The frameworks describe the present, not the future, so the most important habit is naming what would break your read before you act on it. Done that way, industry analysis stops being a diagram and becomes a genuine edge in deciding where capital belongs.
Worth the read?


