Price Action Trading for Beginners - Read Clean Charts
Price action trading for beginners is not about memorizing patterns. It is reading market structure on a clean chart and defining risk first.

Most beginners treat a price action trading strategy as a collection of candlestick shapes to memorize. That is the wrong starting point. Price action trading for beginners is the practice of reading raw price on a clean chart, using market structure and key levels to decide where risk is defined, with no indicators standing between you and the data. The pattern is the smallest part. The context around it decides whether the pattern means anything.
A pin bar at a random place on the chart is noise. The same pin bar at a level the market has respected for weeks, inside a clear trend, with an invalidation you can mark before you click, is a setup. The shape did not change. The structure and the risk did. Learn that order first and the patterns start to make sense on their own.
What price action trading actually means
Price action trading is a method of reading a market using only its price history. No moving averages, no oscillators, no signals derived from price after the fact. You watch how price behaves at levels, how it trends, where it stalls, and where it gets rejected. Every indicator on a chart is built from the same price you are already looking at, so price action removes the lag and lets you react to what is happening now.
The core elements are simple to name and slow to master:
- Support and resistance mark the levels where price has reacted before, the places buyers and sellers have defended.
- Trends and corrections describe whether the market is moving with intent or pausing to catch its breath.
- Market structure is the sequence of swing highs and swing lows that tells you which side is in control.
Reading those three together is most of the job. None of them require an indicator, and all of them are visible on a chart that shows nothing but price. This approach works because it describes behavior, not prediction. You are not forecasting where price will be next week. You are watching how participants react at a level and positioning around that reaction. That is a reactive stance, not a predictive one, and it is the honest way to trade a probabilistic market.
Why a clean chart beats an indicator-loaded one
The first thing most beginners do is bury the chart. Two moving averages, a momentum oscillator, a volatility band, maybe a second oscillator underneath for confirmation. Then the entries feel late and the chart feels noisy, and the natural response is to add another indicator to fix it. The clutter is the problem, not the cure.
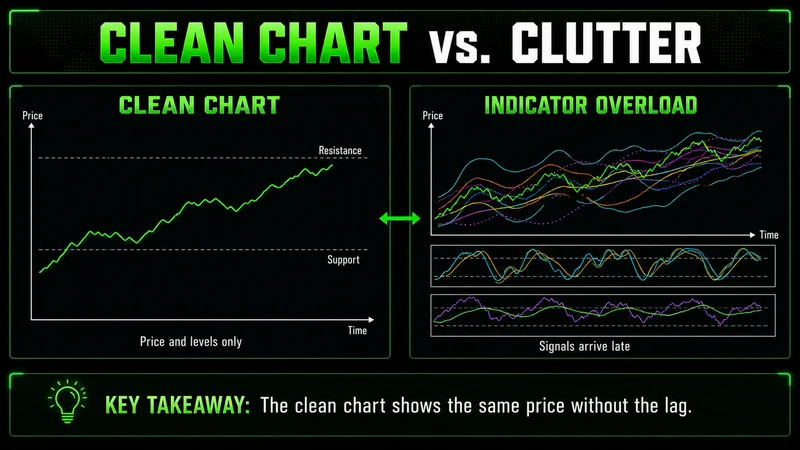
An indicator is a summary of price, not a substitute for reading it. It smooths and repackages the same candles, which means it always arrives a step behind them. A clean chart shows you the same information without the delay: where price is, which levels matter, and how the last few swings printed. When you strip the chart back to price and a couple of horizontal levels, the structure that was hidden under the lines becomes obvious.
This is not a claim that indicators are useless. Plenty of consistent traders use them. The point is narrower. For a beginner learning to read behavior, a crowded chart trains you to wait for a lagging signal instead of watching the market itself. Start clean. Add complexity later only if it earns its place, and most of the time it will not.
Reading market structure: the part beginners skip
Market structure is the skeleton under every price action setup, and it is the piece beginners rush past on the way to patterns. Structure is just the sequence of swings. An uptrend prints higher highs and higher lows. A downtrend prints lower highs and lower lows. A range prints roughly equal highs and lows while the market decides. If you can mark those swings, you can read the trend without a single indicator.
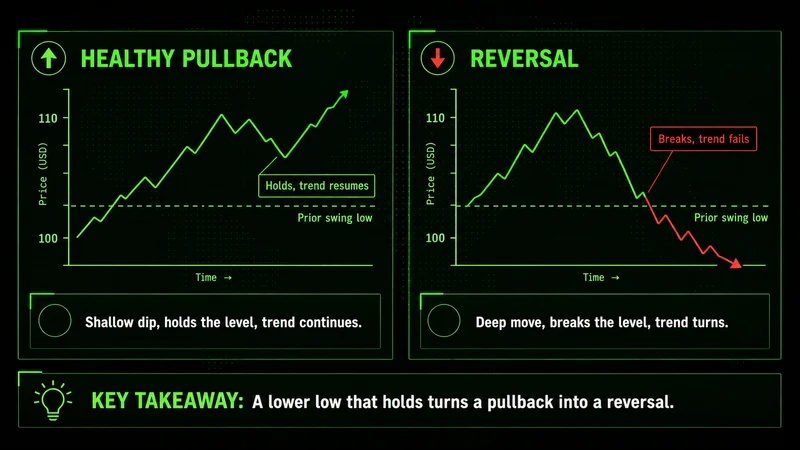
The useful distinction is between a pullback and a break. In an uptrend, price pulls back, holds above the prior swing low, and resumes. That is a healthy correction, and it is where continuation setups live. When price instead closes below that prior swing low, structure has shifted. The trend you were trading is no longer intact, and the same long setup that looked clean a moment ago is now fighting the market.
That single read, whether the last swing held or broke, filters a surprising amount of bad trading. Most beginners take continuation trades into a trend that already broke, then wonder why the win rate collapsed. The chart told them; they were looking at the candle instead of the structure.
Trading without context is gambling with better vocabulary. A setup only earns a position when it lines up with structure, a level, and a defined invalidation.
Four price action setups worth learning first
You do not need a library of patterns. A few reliable setups, traded only where structure supports them, will carry a beginner further than thirty memorized shapes. These four are enough to start.
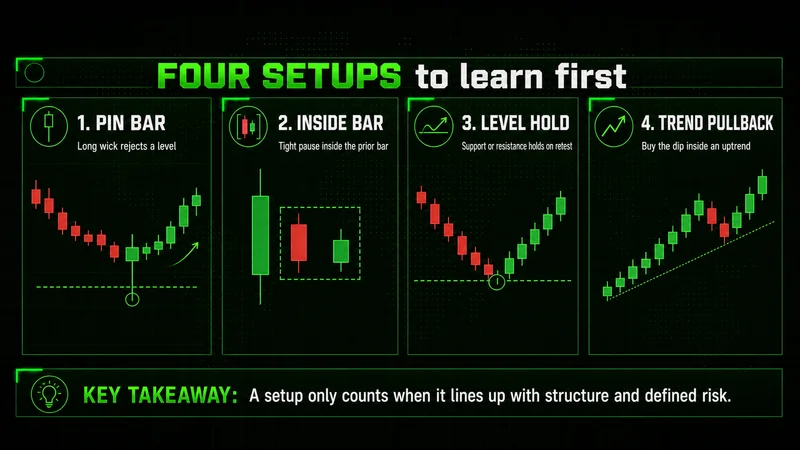
- Pin bar. A candle with a long wick and a small body. The wick shows price was pushed to a level and rejected. It matters most at support or resistance, in the direction of the trend.
- Inside bar. A small candle contained inside the range of the prior candle. It marks a pause, a moment of balance before the next move. Inside bars at the edge of a range or after a strong push are the ones worth watching.
- Level hold. Price returns to a horizontal level it respected before, and the level holds on the retest. This is the plainest setup in trading and one of the most durable.
- Trend pullback. In a clear uptrend, price dips to a prior swing or a level, holds, and continues. You are buying the correction inside a trend rather than chasing the extension.
Each of these is a behavior at a level, not a shape in isolation. A pin bar floating in the middle of a range is not a trade. The same pin bar at the bottom of an uptrend's pullback, holding the prior swing low, is one of the cleaner entries a beginner can take.
Building a price action trading plan you can repeat
Setups without a plan turn into improvisation, and improvisation is where accounts leak. The value of price action is that it fits into a short, repeatable process you run the same way every time. A simple version has four steps.
- Map the structure. On a higher timeframe, mark the trend and the key levels. Decide which way the market is leaning before you look for an entry.
- Wait for the level. Let price come to one of your marked levels. Do not chase a move that is already extended away from structure.
- Require confirmation. Take the trade only when price gives a clear action signal at the level, such as a rejection or a hold. No signal, no trade.
- Define risk first. Set the invalidation and the position size before you enter. If the level breaks, you are out, and you knew the cost going in.
The discipline is in the order. Structure and risk come before the entry, not after. An average entry with a tight, predefined stop can absorb a long run of trades and stay in the game. A flawless entry with no invalidation marked eventually meets the one move that takes the whole position with it.
Run the same four steps on every chart, in every market. When the process is fixed, you can finally see whether a losing stretch came from bad reads or from breaking your own rules, and for most beginners it is the rules that slip first.
When price action stops working
Price action has conditions where it simply stops describing anything useful. The signals that read cleanly when the market is orderly degrade badly when it is not, and knowing when to stand aside is part of the method, not a gap in it. Three conditions in particular turn reliable setups into noise:
- Thin liquidity. In overnight or pre-market hours, a few orders move price further than they should, and the wicks and levels you would normally trust stop describing real participation. Structure reads cleanly in liquid sessions; on thin liquidity the same sequence is mostly noise.
- The minutes around major news. Price can sweep a level, reverse, and sweep it again before any structure forms. The first move after a scheduled release is often the least reliable opportunity on the chart, and reacting to it emotionally is a common way beginners give back a week of gains.
- Low-quality ranges. When the market is chopping with no clear higher highs or lower lows, levels get broken and reclaimed constantly, and every setup looks like a trap because most of them are.
The same pin bar that means something at a defended level in an active session means almost nothing on a quiet book or in the chop. Forcing trades through conditions like these is usually more expensive than waiting, and waiting is part of the job. When the chart stops printing clean structure, doing nothing is frequently the strongest move on the board.
Common mistakes beginners make with price action
The same handful of errors show up again and again, and most of them come from treating patterns as the whole strategy instead of one input.
- Trading patterns without structure. A setup with no trend or level behind it is a coin flip dressed up as analysis.
- Skipping the invalidation. Entering without a predefined level where the idea is wrong turns a small operational loss into an emotional one.
- Overloading the chart. Adding indicators to confirm what price already shows reintroduces the lag price action was meant to remove.
- Forcing trades in dead conditions. The fix is almost always tighter selection and a higher bar for entry, not a longer list of setups to hunt.
- Sizing too large. If a single stop-out changes how you think about the very next trade, the position was too big, regardless of how good the setup looked.
None of these are analysis failures. They are execution failures, and they get fixed by running the same process on every trade rather than improvising when a chart looks exciting.
FAQs
What is a price action trading strategy for beginners? It is a way of trading that reads raw price on a clean chart instead of relying on indicators. A beginner marks market structure and key levels, waits for a clear signal at one of those levels, defines the invalidation and size before entering, then manages the trade against that level.
Can you trade price action without any indicators? Yes, and that is the point of the method. Every indicator is derived from price, so a clean chart with support, resistance, and the swing sequence already contains the information. Beginners are usually better served by removing indicators and learning to read behavior directly.
Is price action trading good for beginners? It is, as long as the focus stays on structure and risk rather than memorizing patterns. Price action is simple to start and slow to master. The early progress comes from reading trends and levels well and defining risk on every trade, not from collecting setups.
Worth the read?