
Bid-Ask Spread and Slippage Explained
Bid-ask spread and slippage explained for traders — what they are, why they happen, how liquidity shapes them, and how they compound into a real cost.
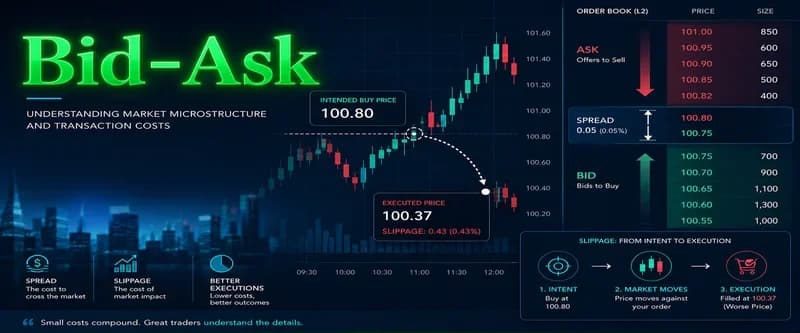
The bid-ask spread and slippage are explained in practical terms: the spread is the difference between what buyers will pay and what sellers will accept, and slippage is the gap between the price you saw and the price you actually filled at. Both are real costs. Both compounds. Most beginners think of them as small frictions on individual trades; treated that way for long enough, they quietly become the largest line item on the year.
The headline price on a chart is a midpoint, not a transactable price. Every order pays the spread to enter, pays it again to exit, and pays slippage on top whenever liquidity is thin or the move is fast. Once that is internalized, position size, order type, and session selection stop being abstract preferences and start behaving like cost controls.
What the bid-ask spread actually is
The bid is the highest price a buyer is currently willing to pay. The ask, sometimes called the offer, is the lowest price a seller is willing to accept. The spread is the distance between those two numbers. When a trader sends a market order to buy, the order crosses the spread and fills at the ask. When the same trader exits with a market order to sell, the order fills at the bid. The round trip cost is the spread itself, paid before the position has moved a single tick.
On a liquid name like ES futures during cash hours, the spread is one tick — a quarter point, twelve dollars fifty per contract. On a thinly traded equity option, the same trader might face a quoted spread of fifty cents on a two-dollar contract, which is twenty-five percent of the position cost before any market move. The instrument decides the floor; the session and the size decide how often it widens.
How market makers profit from the spread
Market makers post both sides — a bid and an ask — and earn the spread when both sides get filled across the day. Their edge is not direction. It is the willingness to provide immediacy. The trader who needs to be in right now pays the ask. The trader who wants to wait posts a bid and gets paid the spread instead of paying it.
This is why the spread is sometimes called the price of liquidity. The market maker carries inventory risk between the buy and the sell, and the spread compensates for that risk. In stable, deep markets, the spread is narrow because inventory risk is low. In fast moves or before scheduled news, market makers widen quotes to protect themselves, and the cost of immediacy rises sharply for everyone else.
How to read spread on a depth chart and order book
The order book stacks resting bids on one side and resting asks on the other, with the best bid and best ask at the top. The depth chart visualizes the same information — cumulative size on each side at each price — so the shape of available liquidity becomes obvious at a glance.
A few things to watch on any book:
The top-of-book size. If only ten contracts sit at the best bid and a trader sends a market order for fifty, they fill the first ten at the bid, then walk through the next price level, then the next. That walk is slippage in real time.
The shape of the stack. A book with even, thick liquidity at every level absorbs size. A book that thins out two levels deep tells the trader that any meaningful order is going to push the price.
The behavior at key levels. Resting size at round numbers or prior swing points is often pulled the moment price approaches. Liquidity that looks supportive on the book frequently disappears when it is needed most.
Reading the book is not predictive. It is a snapshot of current intent that updates by the millisecond. The value is in noticing when intent thins out — that is when execution quality degrades fastest.
What slippage is and why it happens
Slippage is the difference between the price expected at order submission and the price actually received at fill. A market order sent when the best ask was one hundred dollars and filled at one hundred dollars and three cents experienced three cents of slippage. On one share it is rounding error. On a thousand-share order during a fast move, it is thirty dollars.
Two forces are behind it. The first is liquidity — if the order is larger than the size resting at the best price, it walks the book, and each step up the ladder is a worse fill than the last. The second is volatility. Between order submission and order arrival at the exchange, the quote can move. In a fast tape — the seconds after a Fed statement, an earnings beat, a CPI print — quotes move several ticks before the order completes its route.
Positive slippage exists too. A market buy can occasionally fill below the displayed ask if a better offer appears in the microsecond between submission and execution. It happens; it is rare; planning around it is not a strategy.
How liquidity shapes spread and slippage
Liquidity is the underlying variable that controls both costs at once. Deep, two-sided markets give narrow spreads and small slippage. Thin markets give wide spreads and unpredictable fills. The same instrument can move between both states in a single day.
Three liquidity conditions worth distinguishing:
Peak liquidity. Cash hours for U.S. equities and index futures, London-New York overlap for FX, exchange peak hours for crypto. Spreads tighten, depth stacks up, and execution quality is at its best.
Off-peak liquidity. Pre-market, after-hours, weekends in crypto. Spreads widen, depth thins, and the same market order that costs one tick during cash hours can cost several.
Stressed liquidity. The first minutes after major news, halts, circuit breakers, or fast unwinds. Spreads can widen by an order of magnitude. Stop orders convert to market orders and fill wherever the next resting size sits, which is often nowhere near the trigger price.
Structure reads cleanly during peak liquidity; in stressed conditions on thin books, the same setup means almost nothing, because the execution layer overwhelms the analysis layer.
How spread and slippage compound across a year of trades
This is where most beginners undercount the damage. A single round trip on a liquid equity might cost a few cents in spread plus a cent of slippage. Trivial. Multiply by frequency and size and the picture changes.
A trader running ten round trips a day on five hundred shares, paying an average of four cents per round trip in combined spread and slippage, gives back twenty dollars per round trip, two hundred dollars per day, roughly fifty thousand dollars across a two-hundred-and-fifty-day trading year — before commissions. The same trader who convinced their edge is in entries is spending a five-figure budget every year on execution they have not measured.
For futures traders, the math is sharper. One tick of slippage per round trip on NQ is five dollars per contract. Twenty round trips a day on three contracts is three hundred dollars, daily, in execution alone. None of it shows up in the chart. All of it shows up in the equity curve.
The takeaway is not that frequent trading is wrong. The takeaway is that execution cost has to be measured per trade, per session, and per strategy, the same way risk per trade is measured. Otherwise it grows in the dark.
Order types as cost control
Order type is the lever a trader has to decide whether to pay the spread or get paid the spread. Three choices cover most of the decisions:
Market orders. Pay the spread and any slippage. Useful when speed of fill matters more than the price of the fill — exiting risk, hedging into a fast move, entering when the alternative is missing the trade entirely. Costly when used by default.
Limit orders. Specify the worst acceptable price. The fill is at the limit or better, or it does not fill at all. Limits sit on the book as resting liquidity and, when filled, the trader is paid the spread rather than paying it. The risk is partial fills or no fill.
Stop orders. Become market orders once triggered. This is critical to internalize — a stop is not a fixed exit price, it is an instruction to send a market order when a level is touched. In stressed conditions, stops fill far from their trigger. Stop-limit orders convert into limit orders instead, which avoids the slippage but risks the stop never filling at all.
The practical mix depends on the strategy. Discretionary swing traders often use limits to enter and stops to exit. Scalpers in tight ranges sometimes use limit orders on both sides. Trend traders in fast markets often accept market orders on entry because the cost of missing the move is larger than the spread.
Commissions, fees, and the full cost stack
Spread and slippage are the largest hidden costs. Commissions and fees are the visible ones. The full stack a trade pays on a single round trip:
Commission. Per-trade or per-contract fee charged by the broker. On U.S. equities, many brokers advertise zero commission but route orders for payment-for-order-flow, which the trader pays indirectly through inferior execution.
Exchange and clearing fees. Direct costs on futures and options. Small per contract, but they add up across high frequency.
Regulatory fees. SEC and FINRA fees on equities, exchange data fees, and similar charges that show up on the monthly statement rather than the per-trade ticket.
Financing costs. Overnight margin interest on equities, carry costs on rolled futures, funding rates on perpetual contracts. Held positions accumulate these whether the trade is profitable or not.
A realistic execution audit adds spread, slippage, commission, exchange fees, and financing costs together, then divides by total profit. Most retail traders never run that calculation because the numbers are uncomfortable. The ones who do run it usually trade less frequently afterward — not because their strategy stopped working, but because they finally saw the floor underneath every position.
Worth the read?


